
In this renko chart trading video, I am going to do an emini dow futures setup and day trade review for 2-5-2014, beginning at 5:00ct – and a trading period that is in a side ways price range, where the renko chart is difficult to read.
So, one of the things that I especially want to discuss in this video is renko chart trading during price ranges, and how much additional renko chart and trade setup clarity will come from also using a price bar chart.
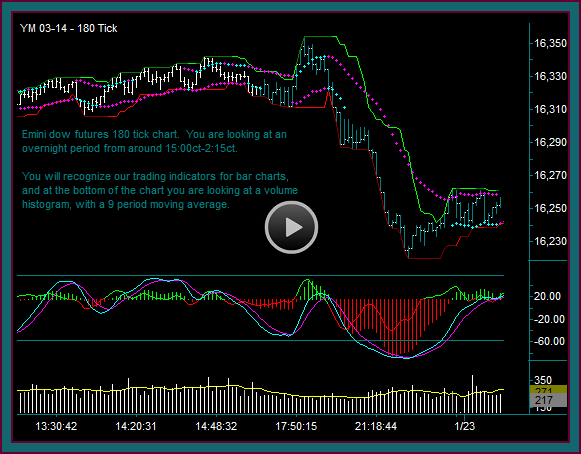
Emini Dow 180 Tick Day Trading Chart
You are looking at the emini dow 180 tick day trading chart – the last tick bar on the chart is 7:15ct. Let’s start here with a chart read, before going to the renko trading chart and looking at trade setups.
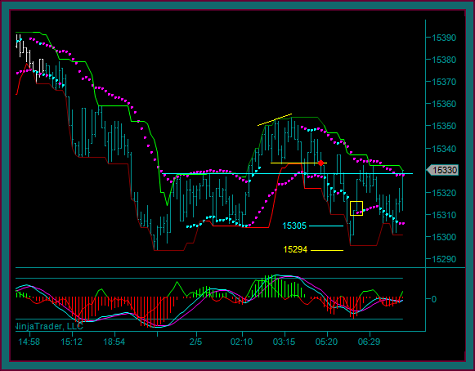
- You can see how we are in a range between 15354 and 15294, with the blue line as a center line
- It’s a price line that has shown some relevance through price action
- The 1 trade I have tried in this area was the red dot sell 15332
- It’s a pmd high-pmd counterpoint break2 with mex flow that would include a failure break of the blue line
- There was also a sync renko setup at the same time
- I watched the 15305 area for a stall-reject – but the 15294 price support was my target
- I don’t really like these horizontal trades back into previous consolidation, because they tend to have trouble getting through – but with 27 to 38 points of profit targets, I took the trade
- NOTE: this is not the same as trading inside of consolidation – if that had been the situation I would not have taken the trade
- Price made it to 15296 – so I missed my target and ended up with a 15304 partial on a red-green renko brick at the low and partial 2 was 15310 on another green brick
- Understand that I am reacting to missing a double bottom low as momentum was going extreme – probably a good time 2 have taken a double partial
- You can also see the difficulties with trade management in these kinds of trading periods – there is no price that should hold as resistance on a retrace, until the blue line and that is a very big giveback
- I went flat at 15314 on the renko midline cross
- We are now back to the blue line and still in sell mode, but look at mex starting to cross and ttm right at the 0 line – this is what I have meant when I have said that an initial reverse is imminent
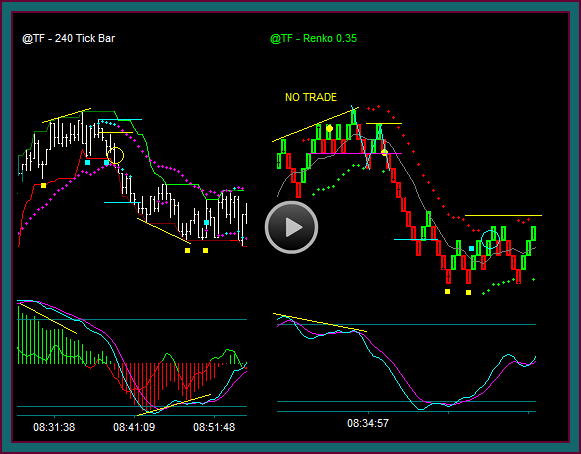
Emini Dow Renko Day Trading Chart
Here is the renko day trading chart that syncs with the 180 tick chart.
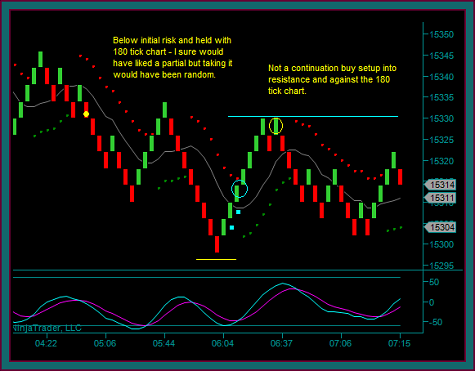
- You can see the yellow dot was the sell and we really did move far enough for partial1 – but with the targets I was using and mex still flowing, it would have been random for me to have done so
- Which clearly sucked with the next renko move
- Renko chart trading only and the trade would be flat – renko chart and 180 tick sync trading and I went ahead and held below initial risk and with the 180 tick chart
- The blue squares and the blue circle was the partials and trade exit
- The yellow circle may be a 3 brick pattern with mex flow, but it’s definitely not a trade setup – not right into resistance and against the 180 tick chart
- Question: Do you see the green-red brick with mex flow midline test as a buy alert?
- Yes – but there is no way to take the trade when we know that (1) the 180 tick is in sell mode [this is before the end of the chart we looked at (2) there would be no profit target using the 15330 area as resistance
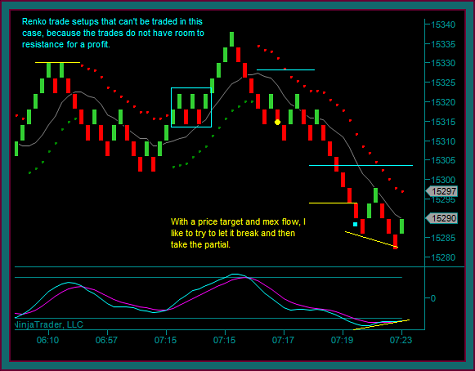
- And the yellow circle is a terrific setup with the midline-reject triple break, but I still can’t take it if I am using the 15330 area as resistance
- Question: Do you see the red-green brick with mex flow midline test as a sell alert – or is this the same problem as the buy and there is no profit target
- Sell 15315 to the 15294 [don’t ignore 15296 and that previous test low] target is 21 points and fine for a profit target
- Sell triggers with the reversal bar – short 15315
- Blue line initial risk area
- No, I didn’t put the line in the wrong place and it should be 15330
- I would never use the exact price – but what I want to do is give the lower high into the trade some room
- Be sure to look at the 180t for this price area and know the actual price
- Initial risk holds and this time there was price continuation down and to the price target
- I am ready to take the partial – but when there is mex flow at the target price [momentum should be synched with the 180 tick chart] I want to try and extend the partial and fill it on the break
- Partial1 15288
At the end of the emini dow renko chart, I am short with 1 partial taken and am ready to take the 2nd partial – right at this point I want to give it a chance to reject the midline area and become a pmd failure and another continuation ‘push’ down.
I want the 15294 price area to shift to resistance, which would sync with the trailing price envelope. The blue renko chart price line 15302 is not where I would hold the trade to.
It’s a price that I want to be aware of as shifting to resistance now, and evaluating a renko buy setup if there is one, in terms of the room to 15302 for getting a buy partial profit.
Be the first to comment