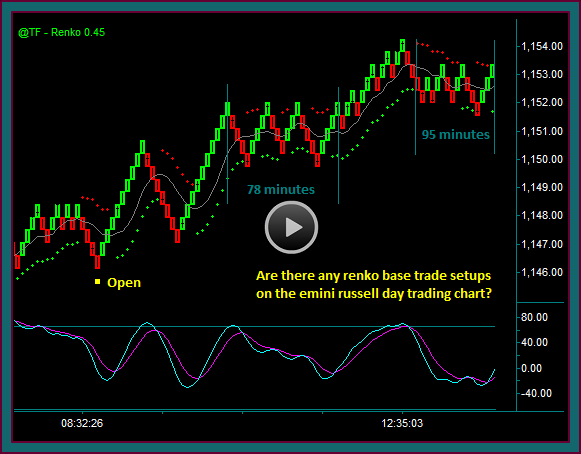
In this day trading training video, we are going to try something new. I am go over a chart recording of renko chart emini dow day trades that I did, where we will see the bricks moving as if it were real time – but I am going to be able to speed the chart up to get rid of dead time.
Also, at key areas I will pause the renko chart and discuss what I did and what I am looking at, which will especially include trade management – for day trade partial profits or exits, and then where a next target and trailing price hold would be.
This is something that I will want to also include in training sessions, where we will be able to do q&a about what is being done, along with being able to do some work that is more like real time trading.
Just as a FYI – from the price low until the next trade is 15 minutes, with virtually nothing that is happening. And that is an example of the problem, with actually doing our renko chart trading discussions real time.
So, we will see how it goes. This is the first try at a video like this, so who knows – they will get better with practice 😛
But if I accomplish anything with these videos, besides the trade review training aspect, it will be:
- To discuss things that you want to look for and plan for while trading
- For instance, where is the next profit target and where will you hold your trade to while trying to reach it
- Or after getting a partial profit and a slow-down or extreme in momentum, what will keep you in the trade and what will cause you to exit
- And then to show periods where there is just nothing to do except wait, until one of the decisions you planned for happens
- I think this will make everyone a better trader – and certainly help to remove stress and emotion, while in a trade
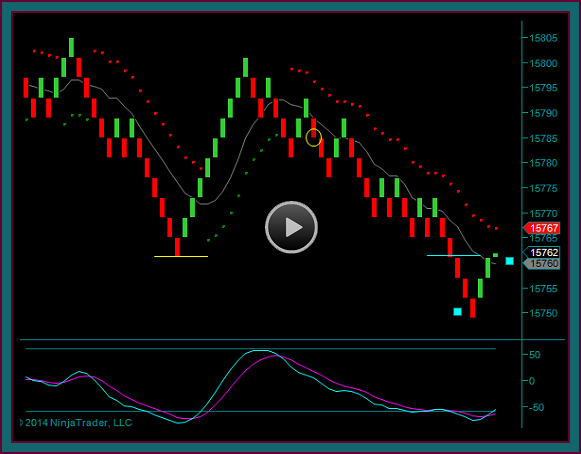
Emini Dow Renko Day Trade Sell Review
I am going to begin with a review of an emini dow day trade that I took preceding the video recording. This will let us identify some left side price points – and then I will start the training recording, when there is 1 trailing contract for the sell left.
Yellow Circle Sell
- 15783 sell – 15761 renko low target
- Target break partial1 at green brick-blue square 15751
- Extend profit 10 points
- If the yellow-blue line had rejected instead would partial on green brick
- Partial2 blue line-midline break and mex extreme cross 15762
Renko Chart Day Trading Recording Outline
(1) With the mex cross and midline break, the price envelope is close to reversing:
- Exit short on price envelope reverse
- I want this green brick to go red and price to get back under the blue line as resistance
- Price envelope reverse – flat 15766
(2) Price envelope reverse
- After exit – now looking for a buy setup
- 15801 upper yellow line would be target
- But note the bricks in the area of the sell initial reverse and then yellow circle
- I would watch price and momentum there and be ready to partial
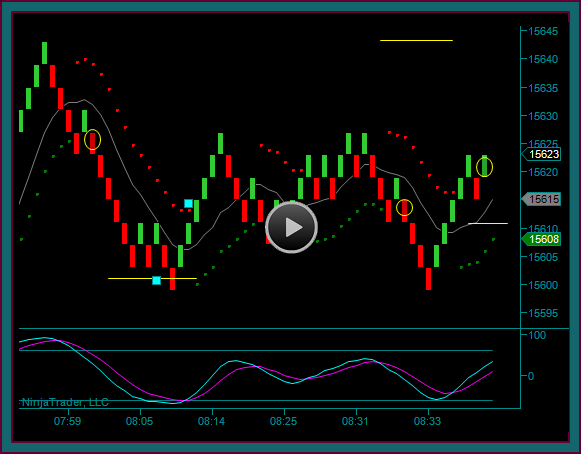
(3) Red-red-green bricks
- 4 brick entry pattern – midline reject with mex flow
- 15764 buy
- Didn’t wait for another green brick to enter, because of the yellow-blue price failure break
(4) 15780 green then red – but mex flow still
- You can partial here for 16 points
- But with the left side diagonal and mex flow – I have still held
- Now at 15785 with mex flow – let break but would take 15782 if doesn’t continue
(5) Moves to 15793 and red brick– 15791 partial1
- Set partial2 target and trailing hold
- Partial2 target 15801
- 15819 target if through
- Hold 15778 area – inside midline and envelope green dots
- You can also see how that fits the brick cluster-break down to the lows
(6) Price envelope reverse
- Price hold test-bounce
- Red-green brick sell alert
- If the next brick is red I am flat
- And would enter a short on the start of another red brick
- Until then I would be looking at a price test –vs- price failure like the buy
- Another green brick
- Price envelope resumption into buy
(7) Hit 15801 but with momentum resumption
- Move partial2 trail line to 15793 area
- 15819 target
- 15815 partial2 – WHY?
- We haven’t been talking about the 180 tick chart – but it certainly isn’t being ignored
- Actual price hits 15818 – and is 180t double top after mex cross
- Was there an addon setup?
- Definitely
- But filling 15803 with a 15819 is a 16 point target
- It is fine to try and take the addon to get that partial
- If I was down to my last contract I would have done the add
(8) With the price resistance momentum extreme I will be looking at a price envelope reverse and 15801 area as support for the hold – the next price target is at 15833 and then 15846 if through.
- Price envelope reverse and 15801 break – 15799 exit
- And from this point I will look for a retrace and green brick midline reject
- Giving a renko sell setup that includes a 15801 failure break entry
Be the first to comment