
Even as we have been emini russell day trading, using renko chart trade setups, I have continued to emphasize the need for including a bar chart for reading price.
Including a tick or time chart with the renko charts would be necessary for any underlying traded, even if the renko chart was traded mechanically, with the price envelope reverse – and I would say this for day trading or position trading.
And why is this the case – the Tactical Trading method strategies cannot be traded without chart reading for price, and the fixed size renko bricks don’t show all prices.
Here are some of the specific things that I want to cover in this emini russell day trading video, with regards to the importance of price when trading:
- 240 tick and renko chart combination trading
- You don’t have to use the 240 tick chart for emini russell day trading. You could select a different tick count if you prefer – just be sure to combine a price chart with the renko chart
- Price and price action
- Moving price across the chart as support and resistance
- Outside price and inside prices
- How the 240 tick chart prices helps with the renko chart trading price and fills
- Chart pattern differences – especially how tick chart price momentum divergences tend to be double brick lows or highs
Emini Russell Day Trading Review 1/6/2014
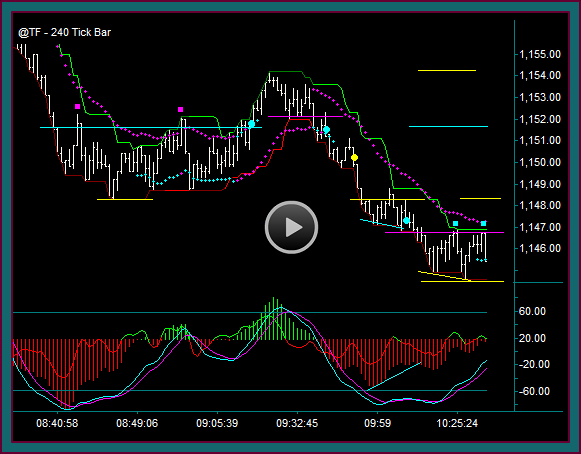
You are looking at the emini russell 240 tick chart on 1/6, starting at 8:41 ct after an opening selloff – the trading period goes to 10:42 ct.
I am going to talk about the trades that were done and how the setups looked on both the tick chart and renko chart. And I especially wanted to cover the period, because we have a ‘textbook’ chart for discussing trading price.
240 Tick Day Trading Chart
Blue Line: 1151.70 overnight low as resistance after low 1148.30
- 1152.20 pmd low counter point [1151.70 test] – 1148.30 low consolidation
- 1152.20 double top
- Buy 1151.80 – consolidation breakout setup with left side diagonal breakout potential from opening sell
- 1154.20 high gives 1153.80 partial profit
- 1152.20 shifts to support as a single price – but focus on 1152.20-1151.70 as a support area
Purple line: 1152.20 break and initial reverse
- 1152.20 reject after initial reverse with mex flow
- Sell 1151.70 as buy reverse
- 1148.30 low support target – 1147.70 profit on test-break
- 1148.30 key shift to resistance to keep swing continuing down
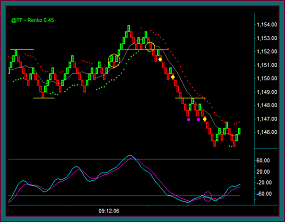
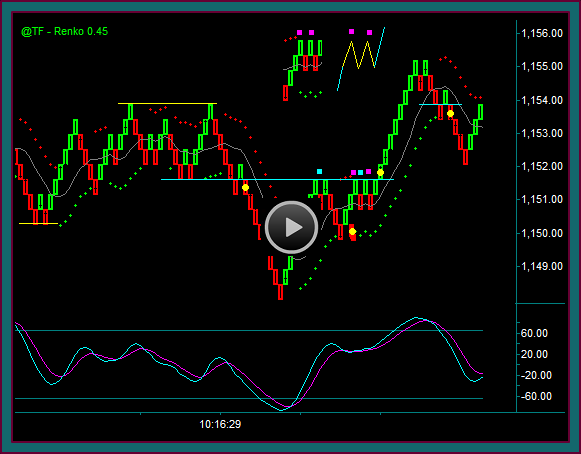
Renko Day Trading Chart
Here is the emini russell renko day trading chart. Let’s look at the sync with 240t chart trades that we just discussed.
- Yellow circle1 sync with 240t buy
- Green-red-green midline reject with mex flow
- Yellow circle2 price envelope-midline roll initial reverse – through yellow blue line and the 1152.20-1151.70 support area discussed on the 240t
- Yellow dot1 renko chart sell would be 1151.50
- Trading with the tick chart-renko chart together showed actual price and give a 1151.70 fill
- Yellow dot2 renko chart sell addon 1150.10
- Do you see this addon setup on the 240t chart?
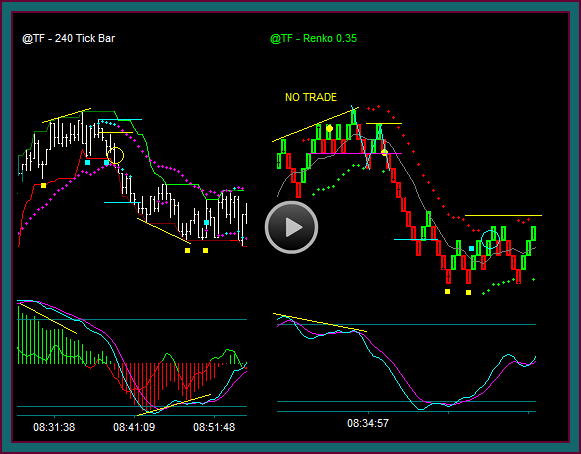
240 Tick Chart
The yellow dot is the renko chart addon sell
- There is no reason not to do this as a continuation addon, but there is no real setup to trade
- The renko chart gives a very clear setup as this is our base renko setup
- Red-green-red brick pattern – midline reject with mex flow
- Note the 240t bar before the yellow dot – selling as close to the break of the bar low 1150.60 gave a 1150.40 fill instead of the renko chart 1150.10 price
- The renko chart gives a very clear setup as this is our base renko setup
The previous low yellow line now shifts to resistance – is there another sell addon related to the shift-reject of that line?
- Pmd low – pmd counter point and 2nd test of the yellow line resistance
- Sell the blue dot pmd failure 1147.20
- A price momentum divergence low means that there was a lower low in price but a higher low in momentum – the pmd failure is a continuation setup looking for directional momentum to resume
- Does this 240t chart trade sync with a renko chart trade setup?
Renko Chart
Yellow dot3 would be the synch setup
- Support-resistance reject double renko brick bottom – this is the 240t pmd low
- Note that the renko chart will typically show 2 brick lows when the 240t shows a tight pmd low like on the chart
- We would have needed another completed brick and retrace to get a pattern that would look like a pmd – this pattern is another reason we want to combine the tick chart with the renko chart for trading
- Red-green-red brick pattern – midline reject triple break
- Using the renko chart only and waiting for mex to cross back, would give entry timing after the breakout and a 1147.00-1146.90 fill
- Where the pmd failure entry, and selling the low of the yellow line reject bar low, gave a 1147.20 trade fill
That ends this emini russell day trading video and our discussion on using a combination of renko charts and tick charts. By doing this, we can get the best price reads, which increases chart and trade setup clarity.
Be the first to comment