
In this video, I am going to discuss position trading charts time frames and using multiple timeframe charts for trading an ETF portfolio.
Specifically discussed will be a recent series of IWM Russell 2000 ETF trades and the related tradeoffs: (1) using a daily chart (2) using a daily chart and 60 minute combination (3) using a 60 minute and renko chart combination.
Additionally, I am going to talk about an ETF options protection trade that is known as an options collar, which has been done on a long IWM ETF trade after it has become profitable.
This options collar will be used to protect the profits in the trade at a point where momentum has failed, along with protecting profit giveback to daily chart support – but the options collar will also give the IWM trade more profit room if it will resume its upside price move.
Multiple Time Frame Chart Trading
IWM Daily Chart
You are looking at the IWM daily chart and I want to point out some key prices and price action from 12/11.
- 12/11 daily chart reverse 110.37
- Any trailing longs would be from around 110.20
- 12/12 swing low 109.32
- Goes back into buy 12/20 112.90 – 115.97 swing high
- 114.16 target1 left-right
- 111.62 price support
So, you know that I haven’t talked about using daily charts in our method and I really don’t us them. As, I discussed this chart and what was involved I was pointing out what I don’t like and the tradeoffs involved – specifically the amount of giveback to an exit, along with the additional time and movement for a resumption.
Yes, it works well on big continuation moves that don’t retrace – but it has profit and management problems with price movements that drift and have retraces that reverse the chart.
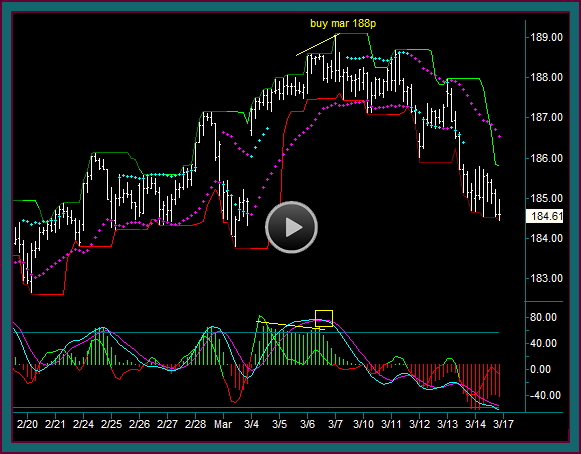
IWM 60 Min Chart
Now we are looking at the 60 minute chart and the time frame I mostly use for position trading. Look at the buy from 12/13 and the circle – but also note that there is a profitable sell on 12/10 at around 112.02 and the yellow dot, before the daily chart reversed at 110.37.
This trade was discussed on a previous IWM renko chart position trading video.
- Long 12/13 into 110.37
- There were retraces – but no complete reverse
- 12/27 ttm reversed but no purple dot shift
- 12/31 ledge could not break 115.71 – this synchs with renko .30 brick chart and a mex extreme cross
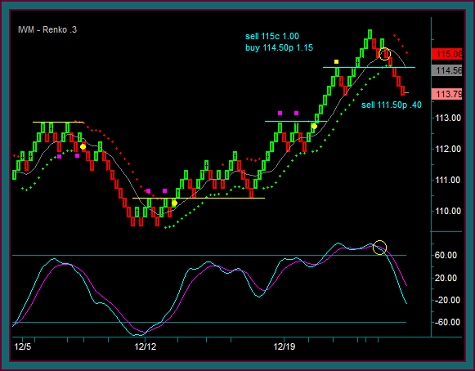
- 1/2 reverse 115.03
- 113.66 reverse low – 114.78 shifts to res and 113.10 next target
- The yellow circle and the synch with the renko chart is the key to the options collar timing
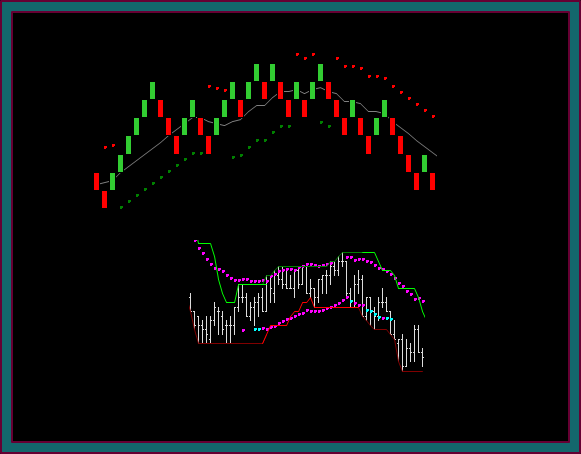
IWM Renko .30 Brick Chart
Now we are looking at a renko brick chart, and a chart type that I have recently added to the 60 minute chart for a multiple trading chart combination – this chart also shows the timing used for the options collar trade.
- Long 12/13 110.30
- Reverse 12/18 but at support – held trade
- 12/20 112.70 addon
- Video: https://tacticaltradingstrategies.com/renko-charts/renko-position-trading-chart-russell-2000-etf/
- 1/2 red-green-red brick pattern and midline cross, with mex cross 114.92 – this actually occurs before the open, but it does setup the price envelope reverse, and with that I want to do the options collar
- 1/10 options – 9 days to expiration
- Renko price envelop reverse 114.62 left res-brick low shift line – initial reverse
- 115c 1.00 114.5p 1.15
- 12:50ct 115c .55 114.5p 1.42
- 1.00 – .55 = .45 call profit | 1.15 – 1.42 = .27 put profit
IWM Options Trading Scenarios
What if trading daily chart and it never reverses but short 115c 1.00
- .72 profit on synthetic
- 115 call breakeven is higher than 115.97 high
- 60 minute and .30 renko will have reversed back into buy for a trade – or for a continuation addon to the daily chart
Your options trade would be a collar on the potential reverse. You could have done the collar as described and then sold a 111.50 put at .40
- Synthetic -115c 1.00 +114.5p 1.11 = .11 debit
- -111.50p .40 = .29 credit – and you have protection below the daily support
- The objective would not be a trading credit – it was protection of a specific price range as cheaply as possible
- NOTE: it would be fine to have done these options with another week to expiration – the issue for this specific trade and the IWM prices is that the 1/18 expiration didn’t have .50 strikes available.
Yes, the options basics take some getting used to, but this is a big part of what I am trying to teach the group. An option collar trade like has been described is a common trade done against a portfolio position. These are done to protect paper profits, while still giving the trade room to become more profitable – after there are signs that price is having trouble continuing further.
What may make our trades more complicating is the timing and legging aspect used to get better options prices. But what have we done that is that much different than using timing for trade entry and partial profit taking – don’t all trades have a setup and timing component to them?
- We sold a call and bought a put against the long etf, when it couldn’t break a lower high and momentum was failing
- We sold a put to create a debit spread that would cover a price range down to daily support – and to be able to do the trade at no cost
Using Multiple Time Frame Chart Combinations
My problems with the daily chart is the amount of giveback before a reverse, and then the amount of time before a resumption if one occurs. We saw an example of this when the daily chart reverse ‘picked’ the low at 109.32 and doesn’t go back into buy until 112.90.
I have always been a proponent of multiple chart trading and having a position chart and a timing chart. So, if I was trading the daily time frame I could also have a 60 minute chart to see extra bars. This would facilitate less giveback and tighter management, along with less price room before a resumption if the position chart doesn’t reverse.
The multiple time frame charts fit our trading method strategies for giving some additional trading opportunities, from reverses and resumptions, or from addons on the biggest moves – again without having to wait as long, both in time and price movement, before the trades occur.
I would prefer a faster combination like a 60 minute position chart, with a renko chart – the point of the renko would be a chart reading aspect compared to another time frame. Or even a fast-slow renko combination, where the slower renko chart would replace the 60 minute.
And then I want to do option trades of some type, whether it is simply a covered call at a resistance or momentum failure when long a stock or etf.
I like the synthetic trade as discussed, because it increases the amount of protection. The third leg and completing a short call-long put-short put combination can be done very cheaply if not a credit, and that option combination can give protection to where the long chart would reverse.

Be the first to comment