Our previous two facebook stock and options combination trading videos discussed chart price patterns for continuation and reversal. The videos ended with a strategy question to think about before it was discussed, here are the 2 questions:
(1) The facebook stock and options trading adjustments video asked: What is your options trade scenario at the blue circle?
(2) The price reject continuation trading video asked: Is the blue dot a confirmed support reject trade setup?
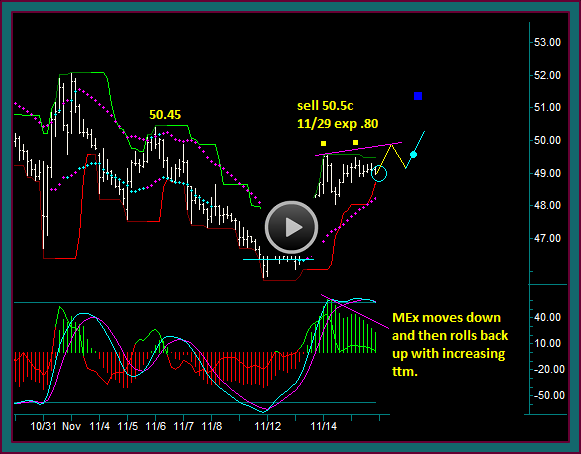
Here is the 60 minute Facebook chart asking about trade scenarios. And you know that when planning for different trading scenarios that you want to prepare for a move in both directions.
So let’s first think about a continued move up from this point, since the chart is in buy mode and we are long facebook stock from the green dot.
- At this point we look for a stock continuation buy setup, which would need the following trade components:
- Since we have had a double top and a mex cross, but not a pmd high yet – I want to see mex move down with a stock bounce to the pmd high
- And then a mex rollback with momentum rising again
- The key to continuation at this point is a momentum resumption
But what makes the continuation especially important is the calls that were sold after the double top mex extreme:
- So the continuation scenario is a short options protection trade
- This is especially the case, considering that the best I could with current implied volatility and options prices is sell 50.5 calls for the 11/29 weekly expiration for .80
- Facebook stock is 49.25 when the options trade was done – the continuation buy as drawn on the chart would be around 49.55
- The first price target would be 50.45
- If the addon is done, trade a size that would cover the short options that the green dot buy isn’t covering – and allow yourself the ability to take a partial profit
- If we are going to get a continuation setup where an options short protection trade ‘needs’ to be done, then I want to have some extra trading size to take a profit on the trade
Facebook Reverse Continuation Chart Pattern
Now let’s discuss the sell scenario and do a review of the trades done from the price reject continuation video, along with talking about the question that ended the video.
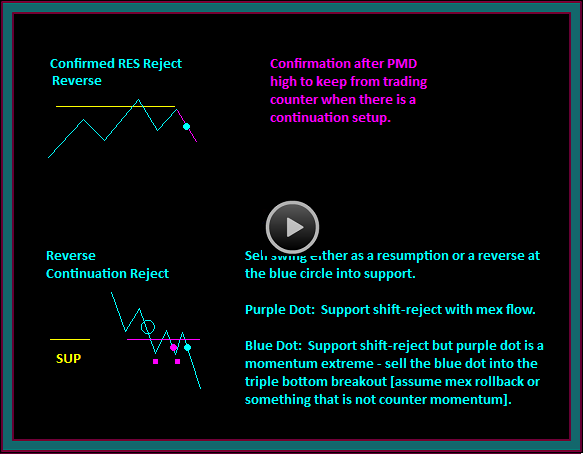
- Since this is a reverse setup after the double top, we would like to get a confirmed resistance chart pattern
- But with the amount of consolidation after the double top – I will be looking for some breakout of the consolidation lows, followed by a retrace with mex continuing to fall after the cross
- Something that starts to show some momentum build – trading out of consolidation is always very difficult, especially when looking for price patterns
- Since Facebook stock will likely still be long at this point, I want to buy a put and sell a call
- But a call has already been sold, so that leg has already been done
- However, another call closer to the money could also be sold, in order to give a more sensitive options synthetic short
- This goes along with previous discussions about options sold for income –vs- options sold for trading
- The 50.5 call would be sold for income, which is covered by the long stock and the continuation scenario for covering any additional shorts
- The call that would be sold for trading would be at the 49.5 or 49 strike, to make a synthetic sell combination with the put buy
- If this sell scenario trades is done, it needs to be managed just like a short stock trade, since that is essentially what it will be the equivalent to
Let’s first look at the 60 minute chart:
- The red dot synchs with the 5 minute red dot – the price shift-reject continuation sell with the gap
- I took the short instead of holding with the options trades
- This was actually the bar before the initial reverse, but it was at a time that I didn’t want to be long facebook
- So I took the short as a day trade, with the scenario for going back long to protect the options if there wasn’t any price movement down
- NOTE: Look at the mex and momentum build as price went down to support
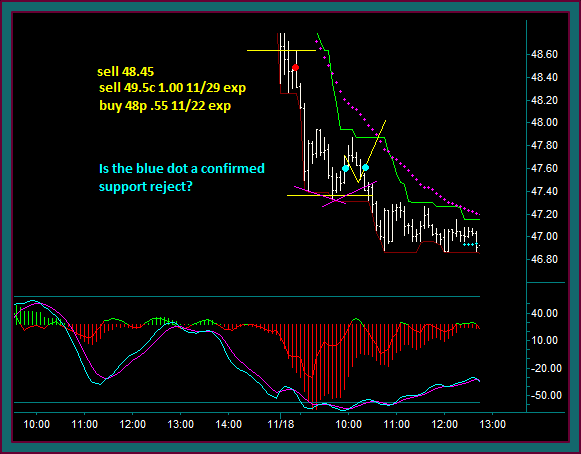
Now we will look at the 5 minute chart with the confirmed support reject question – but further to the right after a pmd low-support failure breakout.
- I showed the chart in this way, because I want to be sure it was discussed as if it was real time –vs- someone automatically saying there wasn’t support confirmation, because it kept going down instead of reversing
- That is definitely not the way to study charts
- I have taken the blue dot trade many times after the support pmd low-mex cross combination – when the trade is against open shorts
- But I have a problem with calling this a confirmed support reject
- Especially with the way the 60 minute chart has reversed and momentum is building, which is why we looked at that first
- I also have the problem with those consecutive bars –vs- the yellow line-blue dot scenario drawing
- Where there would have been a retrace followed by a higher low retest
- That price action wouldn’t have been on consecutive bars and there would have been a crown pattern
- On the other hand – the open trade is a call options short from the previous day – with this stock short and options synthetic short combination
- I mentioned in the other video that I didn’t want to hold that 49.5 call short in the synthetic if the trade didn’t work
- What I really wanted to do is get that short call spread off to hold it – and that is especially the case with also having the 50.5 call shorts
- Additionally, if this is a confirmed support reject reverse pattern, it would be the entry timing for turning the long put into a ratio put short
- My answer – this is not quite the confirmed reject pattern we want, but it is very close AND with chart patterns being a construction of bars that is sometimes the way it works
- So the trading decision becomes one of strategies and options trading math –vs- the entry timing pattern
- And what is the worst case scenario
- You do the ratio option shorts too soon and give up some potential credit to have the protection
- The chart pattern becomes a pmd failure-support price failure combination and a facebook stock short addon could be done
The trading decisions that were made:
- Buy the 11/22 exp 48 calls .65 – this will complete a diagonal [with 11/29 short 49.5 calls] call ratio spread
- -2 49.5c 1.00 + 1 48c .65 = 1.35 credit
- Do nothing with the short 50.5 calls .80
- I feel comfortable at 47.60 to hold these calls uncovered with a 51.30 breakeven
- Wait to sell put shorts against the long 48p .55
- This decision was a combination of knowing the potential for this pattern to be a pmd failure –vs- confirmed support reverse
- Along with the momentum build on the 60 min chart
- If we had gotten the pattern similar to blue dot2 I would sell the puts then
So that ends this video and our discussion about the questions from our previous 2 videos, along with the related trades.
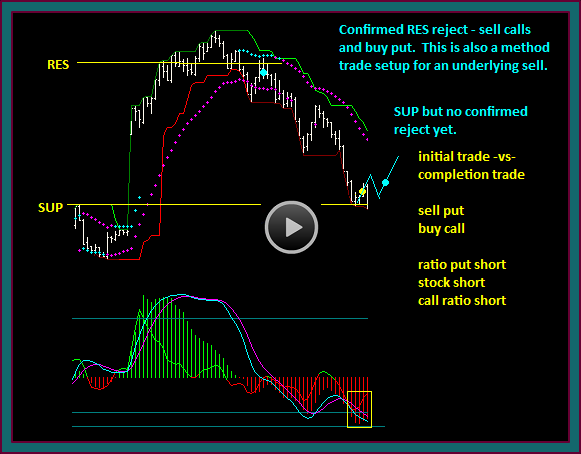
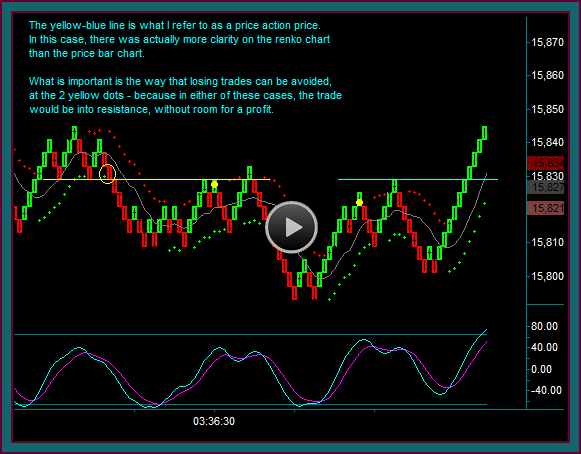
I have another question to end this video – look at the drawing on the chart and the support price shift to resistance: Are either of the 2 yellow dots a shift line reject sell pattern?
Be the first to comment