
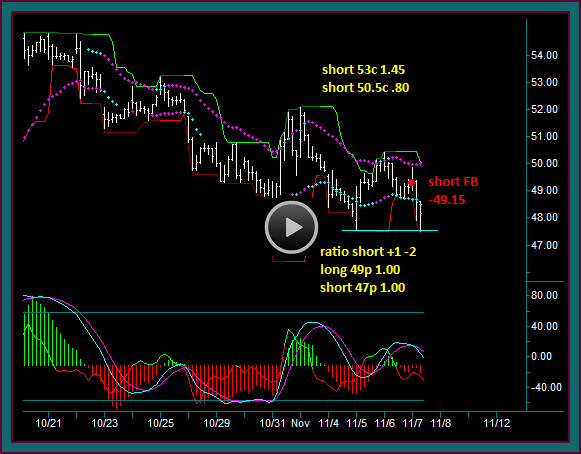
This facebook stock option trading video will pick up at the open of 11-1, which is the bar after the bar that rejects the bottom yellow line.
This is the day after the earnings release. We will start the day using 51.92 as resistance and 49.35 as support.
And based on the leftside swing down, which included a 50.79 double top high [the 2 blue squares] before the move accelerated down – I am watching this area as an inside focus price.
Review 10-31 Trading Day
You will remember that the previous day, after the facebook earnings were released, price opened on a gap down and went to a 46.38 low, but by 10:00 had moved back to 49.35.
This was the daily high at the time and the area of the previous close, giving a potential triple top price continuation breakout – which did occur, leading to a reverse and a move to 51.92.
This was followed by a retrace and retest of 49.35 as support – the move held at 49.56 and a momentum extreme MEx cross. Also note that the 60 minute chart remained in buy, with mex continuing to flow up on the retrace.
Closing Stock Option Position 10/31
The option position at the close of 10/31, as discussed in the facebook earnings day video, was a ratio put short and ratio call short.
- +1 51p 1.25 -2 49p .85
- -2 52.5c 1.00 +1 51c 1.10
Facebook Stock Option Trading Summary 11/1
- Discuss why-where the trailing 49.30 stock long was closed – but no day trade short
- 50.79 price failure
- Draw scenario for going short after put sell was done
- Protection –vs- 60 minute chart mode
- 50.90 stock re-entry
- Price action doesn’t show on the closed bars – but this is the buy done that we looked at on the 60 min and it was clearer using a pre-session chart that had the bars before the day open
- 9:15 51.30 sell 2 52.5 calls 1.40 – 11/15 expiration [note video mistake – called these 53 calls]
- Sell calls expiration after existing ratio short
- Didn’t add to long puts – since stock is a resumption trade and will have the existing protection
- 10:05 draw scenario for stock sell –vs- 60 minute chart location – and a resumption into a triple top breakout
- Day traders would be short
- 10:50 50.70 short with 49.63 target
- Draw scenario for going back long
- Discuss discretionary trade done as day trade on setup where didn’t want to hold long anymore
- 11-1 closing low 49.72
- 60 min hasn’t reversed – MEx crossing
- Closing option position
- +1 51p 1.25 -2 49p .85
- -2 52.5c 1.00 +1 51c 1.10
- -2 52.5c 1.40
- Looking to sell 11/15 expiration puts – depending on a confirmed support reject
- IF underlying is 49.70 – 48 put theoretical value = 1.10 | 47.50 theoretical value = .92
- Call buy would be done in 11/8 expiration

Be the first to comment