
In this video, we are going to discuss the method strategy of trading chart sync, and using a renko chart and tick bar chart combination for emini and futures day trading.
We will look at 2 chart segments, and I am going to ask the following questions:
- Are the Renko chart and price bar chart synched?
- And if yes, do you have a trade setup?
What Is Chart Synch?
When we use the term chart synch, and in this case renko and price bar chart synch – we are talking about the relative condition of each chart at the time of a potential trade, especially for direction and momentum.
NOTE: Using chart synch for day trading is different than position trading, where we use a 60 minute price bar with a faster renko chart for timing and trading in the direction of the position.
For day trading, although we are using different chart types, we are trying to use tick counts and bar sizes that give the charts similar time frames, with the renko bricks.
Chart Synch For Direction And Momentum
Chart synch for direction and momentum is especially important:
- Direction – we don’t want to enter a trade when 1 chart is going in the opposite direction
- Momentum – we don’t want to enter a trade when 1 chart shows it is going to be into a price momentum divergence
NOTE: When chart reading for synch, we are looking at comparing the 2 chart conditions – chart synch is not about getting a trade setup on both charts at the same time.
Emini Nasdaq Renko Chart And Tick Bar Chart
You are looking at the first chart period, it’s an emini nasdaq renko and price bar chart. And you can see the 2 questions (1) are the 2 charts synched at the right side of the chart (2) if they are synched is there a trade setup?
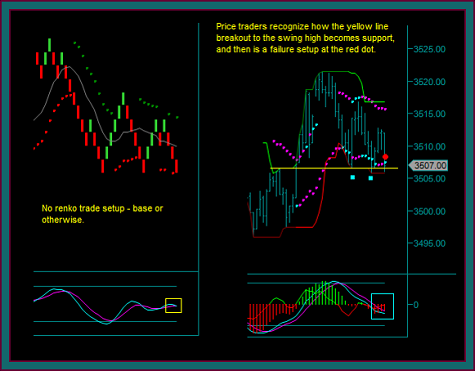
Looking at the 2 charts, I would say they are synched:
- They are both in sell mode
- And with the renko chart mex rollback, there are no issues for momentum direction or extreme
Is there a renko trade setup?
Definitely not, and if I was renko chart trading only there wouldn’t be any discretionary trade I could consider.
But I view the price bar chart differently, especially as a price trader:
- You should see the breakout through the yellow line and the move to the swing high
- That price now shifts to support – and it tests as a double bottom, with mex flow down
- Sell the red dot as a triple break support failure
- And if you look to the left at the low and slightly higher low – those offset double bottom often react like a triple bottom breakout
We are looking at the same emini nasdaq renko and price bar charts, to the right of the previous chart. And again the same 2 questions about whether the charts are synched at the yellow box, and is there a trade setup on either chart?
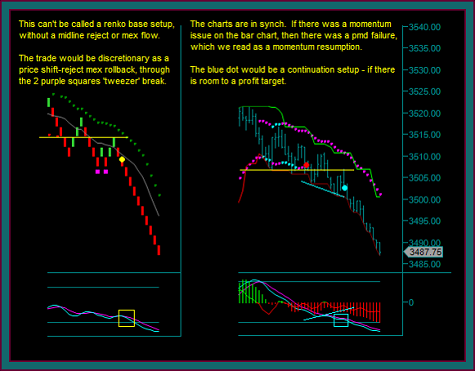
Yes, the 2 charts are synched for direction, and you can see my note regarding momentum. If you would read that momentum on the price bar chart was crossing – recognize then that there would be a price momentum divergence, and a pmd failure is a resumption of momentum.
I would say there are chart setups on both charts. However, the renko chart is a discretionary setup and not a renko base trade setup.
But for a discretionary trade, I like the setup components:
- The yellow price line that had previously been support has shifted to resistance
- After the 2 purple square bricks
- Think of that as a tweezer, and something we see on bar charts where there is a 2 bar high or low and bar inside
- These often have a triple break function, especially when there is a decent amount of time between the renko bricks
- It can be misleading to see bricks that close and also realize that there may be 20+ minutes that has gone by
The price bar chart is the clearer setup as a continuation trade:
- Price shift line reject as resistance
- Either as a pmd failure or with mex flow – either way it’s a continuation setup after the price reject
That ends this trading method reference video on renko chart and bar chart synch.
I intentionally selected charts that didn’t have clear renko trade setups, but did have price bar setups – to further make the point for not trading the charts individually, or trading the renko charts only.
In this case you needed the bar chart to get your trades, and this is a nice winning trade that would have been missed with the renko chart only. However, in other cases there may have been a renko chart trade setup with a bar chart initial reverse.
Be the first to comment