
This emini dow day trading video is going to discuss the setups and trades done on 1-31, between 10:00 and 11:15 central time.
You will be looking at a NinjaTrader renko chart and tick bar chart combination, using a renko brick setting of 4 and a price envelope percent of 0.45, and the synched chart was a 180 tick chart.
There are a number of reasons for selecting this emini dow day trading chart period to discuss – but essentially it was because it was pretty typical:
- There were a few setups that could be traded, but no large extended trades or addons
- The 2 biggest swings during the period had no renko trade setup
- There was a renko trade setup that was a losing trade that could be avoided by price traders
- But it was a profitable trading period
Here is the emini dow renko trading chart. I am sure you can see that the 2 biggest swings didn’t have a renko trade setup.
How many trade setups do you see?
Emini Dow Day Trades
The 3 trades I took during this trading period were at the yellow dots – 2 were winning trades and 1 was a loser.
Yellow dot2 and yellow dot3 should be clear as renko base trade setups. I especially liked the buy as a swing resumption trade that had triple top breakout potential through the previous swing high.
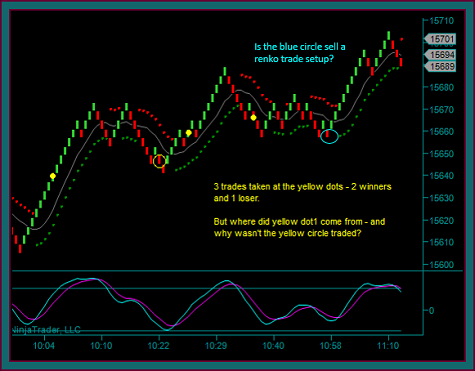
Questions that you probably have at this point:
- Where did the yellow dot1 buy come from?
- Isn’t the yellow circle sell a renko trade setup?
- And a question that I would ask is about the blue circle that wasn’t traded – is that a renko trade setup?
Let me answer the blue circle question. Although that appears to be a renko trade setup that even includes a triple break [this would assume that there is profit target room to the next low as support] – the 180 tick chart shows consolidation and a double bottom.
So regardless of the renko chart, the blue circle is not tradeable using the renko chart and 180 tick chart synch combination, which is the day trading method strategy.
Emini Dow Tick Chart And Renko Chart
You are now looking at the emini dow tick chart and renko chart synch combination, for the yellow dot1 buy and yellow circle sell, from the previous chart.
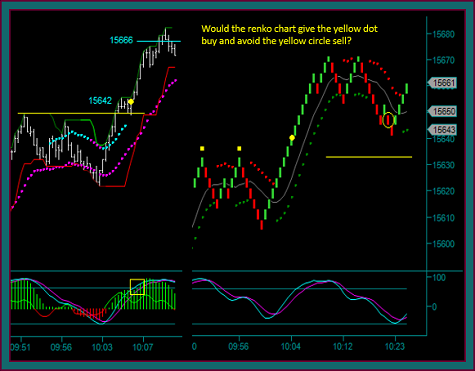
Yellow Dot Buy: And did you watch the renko chart brick combinations video – take a look at your ym renko 3 brick chart at 10:06ct:
- All 3 of the charts are synched, and there is a renko trade setup on the 3 brick chart
- Additionally the 180 tick chart synchs with the renko chart triple top breakout – and there is a ledge that shifts the yellow price line to support and breaks out again, with mex flow as you can see from the yellow box
- You can also see the profit target at 15666 and the momentum extreme there
- If you are a 3 contract trader doing a resumption trade like this yellow dot [and the renko 3 brick trade setup] – this is a situation where I usually take 2 partials, instead of 1
- Also recognizing the size of the overall move including the buy swing before the retrace, which in total was around 100 points at 15666
Yellow Circle Sell: This would be ok as a continuation trade after the price envelope reverse. But the trade would have no profit component back to shift line support.
That covers the emini dow day trades for the trading period, but I do have something else I want to show you on the renko chart, before ending the video.
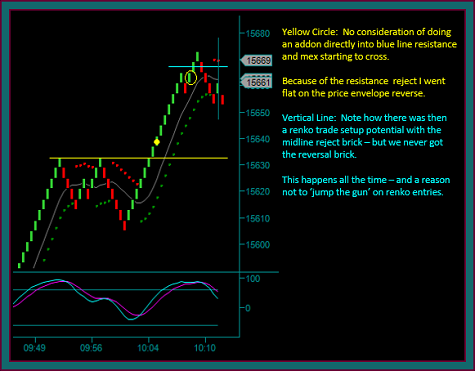
- You can see my note about the yellow circle and doing an addon, using the red-green-red midline reject
- The trade would be directly into price resistance at the blue line – and the 180 tick chart clearly showed the momentum extreme at this point
- But more importantly is the price envelope reverse, with the mex cross and the red-green bricks
- This is especially for you guys that for some reason think you need to ‘jump the gun’ on your renko entries
- Yes, we do have the start of a renko base setup, but this is a very good example of why the reversal is a 3 brick pattern – there never was a red brick like I drew to the right of the vertical line and then next 3 bricks were green, and the trade would be an instant loser
And now a look at one more chart and we will end the video.
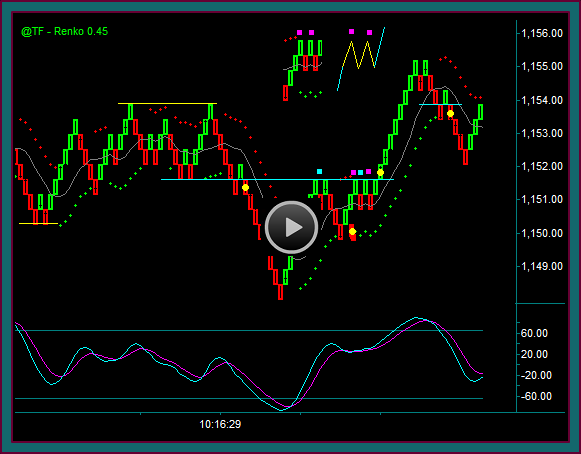
This is my emini russell renko day trading chart [you can see it is a renko .45 brick with a .075 price envelope], and a very good trading period. I plan to discuss the chart on another video, but for now – how many trade setups do you see on this chart?
I will tell you that I took 5 emini russell day trades during this period. You decide where the trade setups and trades were and whether they were winners or losers.
Be the first to comment