
In this video we are going to review renko chart trading inside of consolidation compared to trading past consolidation. This is an important distinction, because I want to avoid trading inside of consolidation.
By waiting for a renko chart trade setup that is regarded as being past consolidation, means that there is a consolidation breakout setup that tends to transition into price continuation.
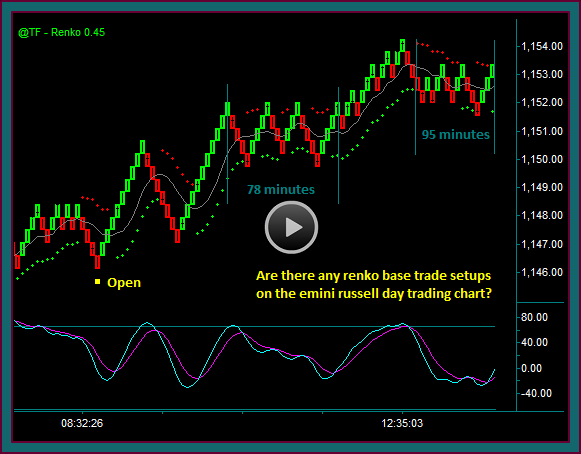
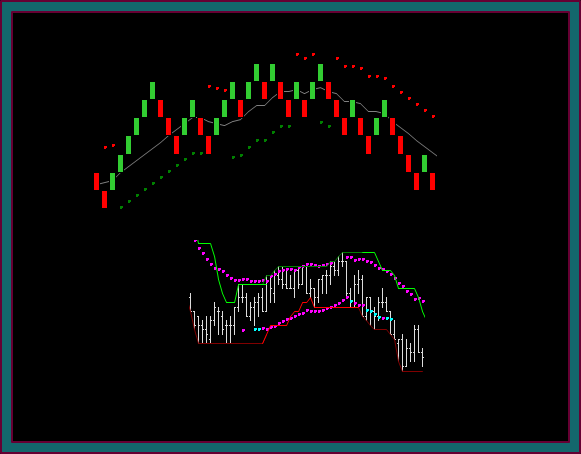
To begin with, we are looking at the renko consolidation training video chart that we last discussed.
The trading period started with a renko base sell setup at yellow dot1 and moved down to a price momentum divergence low, before a price envelope reverse:
- No buy setup with the price envelope reverse and instead went into a sideways consolidation range.
- We described this period and the area inside the vertical lines as being inside of consolidation
- This was a time to avoid trading – the yellow circle was an example of what may look like a midline reject-renko brick reversal pattern with mex flow, but no trade was done
- We then went past consolidation
- This was designated at a time when there was a consolidation breakout setup, as seen at the yellow dot buy
- Besides the midline reject-renko brick reversal pattern – it was also a trade that could be seen leaving consolidation by going through the consolidation triple top breakout of the 2 blue squares
Do you now see the same basic renko chart again?
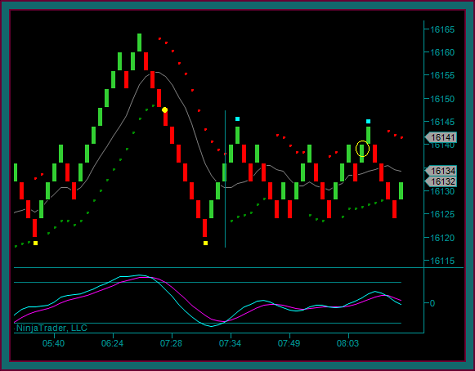
Sell the yellow dot, with a target to the renko double bottom. And then there is a price envelope reverse and a sideways move inside consolidation:
- I ‘hear’ you yelling at me that the yellow dot is not a renko setup – hold that thought
- Do not buy the yellow circle inside consolidation
- The midline reject-renko brick reversal is not a consolidation breakout setup and instead is directly into the blue square as a consolidation double top
- Question: Look at the red-green renko bricks at the right of the chart – are you still inside consolidation or would you be past consolidation if you get the red reversal brick, because that would be a consolidation breakout setup?
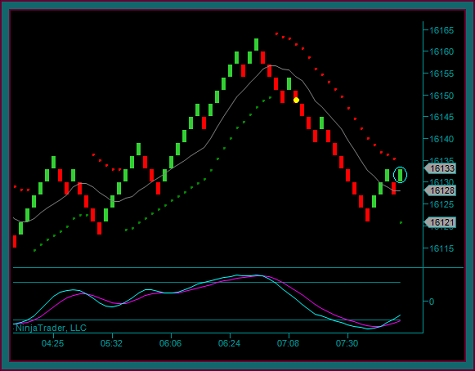
Even with the ‘across the chart’ triple bottom, I still read the yellow circle as being inside the current consolidation range.
But if we would get the red brick-yellow dot at the right side of the chart, I would then trade that as being past consolidation and a consolidation triple bottom breakout – which is essentially the first chart and the past consolidation buy setup on the first chart we looked at, although as a sell setup now.
We did get the sell setup and short the yellow dot, and the midline reject-renko brick reversal with mex flow, as a consolidation breakout trade.
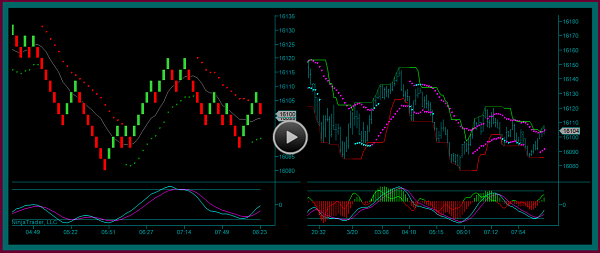
Are you still yelling about the initial sell setup?
- Here it is – you are looking at a renko base setup using the renko brick2 chart that is synced with brick1
I am going to end this video with the following question: Should you be long at the blue circle on the right side of the chart – as another renko base trade setup and a reverse out of the yellow dot sell?
No, the is the renko brick2 chart – the renko brick1 chart has not had a price envelope reverse and the 180 tick is nowhere near an initial reverse, or even a mex extreme or cross.
Be the first to comment