
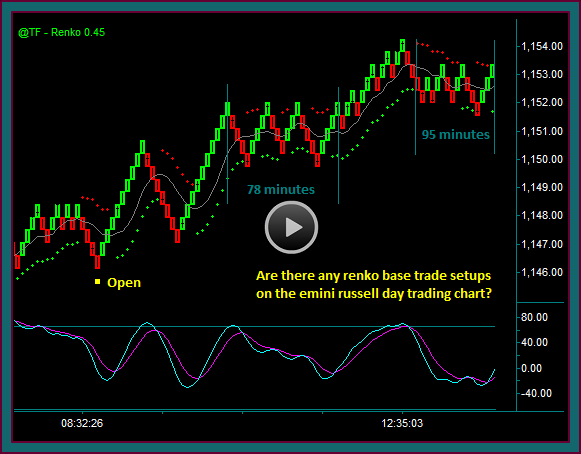
In this renko chart day trading training video, we will begin discussing a series of trades at the end of the extended hour period, and a move into consolidation.
We will then go over the day session open and consolidation trading, determining whether we are trading inside consolidation or past consolidation. Additionally discussed will be trade management and the prices used for initial risk, along with profit targets.
Renko Chart Day Trading Review Outline
(1) Yellow circle
- Sell 15624 – base sell setup
- Initial risk 15635 – goes above the green reversal brick and midline
- Target1 15601
- Hit partial on pmd low and then flat on the price envelope reverse 15613
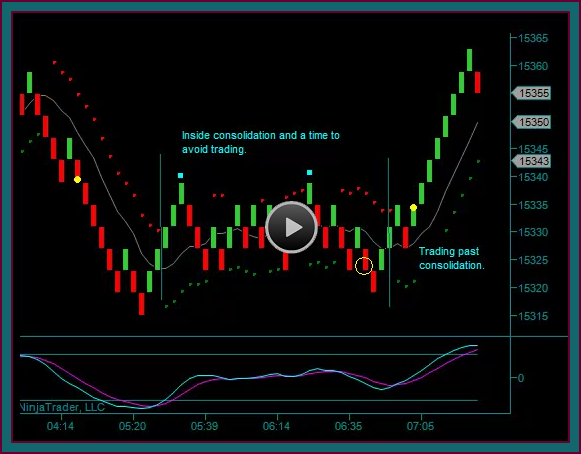
(2) Do you see any renko setups between the exit and the right side of the chart?
- No buy – resumption sell inside range and no mex flow to setup
- We are inside consolidation now – clear on 180t
- Renko brick buy1 – inside consolidation and directly into resistance
- Renko brick buy2 – inside consolidation and directly into resistance
- But isn’t it a triple top breakout setup?
- Chart condition differentiation – yes, but inside consolidation it is a resistance breakout
- If the trade was to be done I would want the start of another green brick
- Renko brick red-green sell alert
- Still inside consolidation because no triple bottom breakout setup
- NOTE: this is what I would call diagonal consolidation instead of horizontal consolidation because of the trendline
- But you can only make 10 points on a support reject
- The trade is a ‘scalp’ that you would take because of the diagonal and then see if you can continue through
- Just be clear that this is not the past consolidation breakout setup
(3) Sell 15612
- I don’t typically use resting limits for partials – because of the consolidation-scalp nature of this trade, I entered one at 15601
- Now the problem – after the partial, what can you use to hold the trade
- Typical of consolidation, which increases the trading difficulty
(4) Flat on price envelope reverse 15617
- +11 partial -5 *2 loss = +1
- I don’t mind a breakeven trying to be short and break support
- But this also shows the nature of a trade without a ‘real’ profit target
- If you are going to do a trade like this – be sure you know where you will get out
And now we are in chart buy
- Waiting to see if we get a midline reject brick pattern to go long
- And this time I would call the setup past consolidation because…
- It will be after the support double bottom
- And be a center area reject with mex flow into a consolidation triple top breakout setup
- If the trade fills around 15620
- It will have the top yellow line renko 15643 for a target
- Placing initial risk is still tough, but this is what is important about having the midline reject brick AND mex flow
- It tends to give a quicker move in your trade direction – allowing you to use the area under the midline for initial risk
(5) Buy 15622
- Still fine with 15643 for target1
- Initial risk area 15610
- 15640 then red brick – if you fill 15638 you have a 16 point partial
- I will keep mentioning these as fine to take as you progress with hold comfort to your target and even extending the partial
- Move hold to the 15625 area, under the previous resistance – you would never want this to become a losing trade on any trails at this point
15642 actual price doesn’t show up on the renko chart
- 15638 partial
- Responding to the lower high resistance test-renko double top and losing momentum
- Just saw why we don’t put our holds at the price – but give it some room
15655 next target
- 15657 partial2 on the break-red brick combination
- We have progressed to another target AND it’s resistance with momentum extreme
- I am going to look for the price envelope resistance to hold
- Price envelope reverse and you can see how hard the yellow line area is trying to hold – it breaks and I am flat
(6) Flat 15645 AND as always – it is now time to start looking for a midline reject-brick pattern that will put us in a sell
Short 15641
- 15652 initial risk area
- 15627 area target1
- 15623 partial1 [15621 real price]
- After partial1 I want to reset my hold and partial target
- Bring hold down to the 15463 price area
- Chart support is the low as a target
- But I am also going to watch 15615, since that was the low into the consolidation breakout and could act as support
Be the first to comment