
This emini russell day trading video is going to discuss multiple chart types and combining renko charts and tick charts. I am going to talk about the benefits from trading with a combination of the 2 chart types, along with going over my emini russell day trades from 1/3/2014.
When I first discussed using renko charts for emini russell day trading, I compared the renko charts to the tick charts we have been used for trading.
And although my primary focus was on the addition of the renko charts to our trading method, we were also talking about trading with multiple chart types.
My intentions are not to replace tick charts for day trading the emini russell – but to trade with a renko chart and tick chart combination that can be beneficial for increasing our price and chart reading clarity.
Emini Russell Renko Chart And Tick Chart Combination
Tick Charts
The tick charts are critical to our day trading chart reading, because they show us real price. And we cannot trade our method without price – and although we may have a terrific trade setup, the trade will not be taken if it is directly into a left side price, because the trade will not have a profit component.
Other characteristics of tick charts:
- They will be especially important when combined with the renko charts, because the fixed renko brick size can miss the key price points
- The left side prices that need to be brought to the right for support and resistance
- Previous price action that shows price rejects followed by directional continuation
- Previous price action that shows breakout areas leading to continuation – especially those that include a resistance breakout that shifts to support, or a support breakout that shifts to resistance
- Tick charts show us bigger price patterns across the chart, including breakout potential and trend lines
- Tick charts and the dc indicator [remember that those initials stand for direction-consolidation] shows us directional swings –vs- periods of consolidation
Renko Charts
The tick charts seem pretty significant, so why use the renko charts for emini russell day trading? Remember, we are combining the tick and renko charts – we aren’t replacing the tick charts.
And this is what the combination of multiple chart types is intended to do – they further increasing chart reading and trade setup clarity, over what either chart could show individually.
When we did the etf position trading multiple time frame chart video, we discussed a time frame chart and renko chart combination. And there would be multiple time frames depending on the renko brick size selected, the multiple chart types gives an additional benefit.
Characteristics of renko charts:
- Renko charts do a very good job of removing noise from a chart
- This helps avoid day trading during consolidation
- But also helps to see a consolidation breakout setup that would otherwise be missed
- Renko charts do show good setup patterns
- We have discussed our base trade setup as a brick pattern with a reject brick and reversal brick – and often times have seen how the setup is even better, when there is also a brick triple break as part of the trade
- Our renko base trade setup is extremely clear to see on the chart – as are addon trades
Emini Russell Day Trades 1/3/2014
240 Tick Charts
- This chart shows the overnight high and then a consolidation period lasting until 10:28ct – do you see any trade setups?
- I don’t see an open trade that would be more than an indicator reverse
- I could consider the yellow circle as a consolidation breakout setup – but not into the daily high as double top resistance
- The blue dot sell at 1151.40 was my first trade of the day – the trade has room to the daily low of 1150.00 for a partial profit target
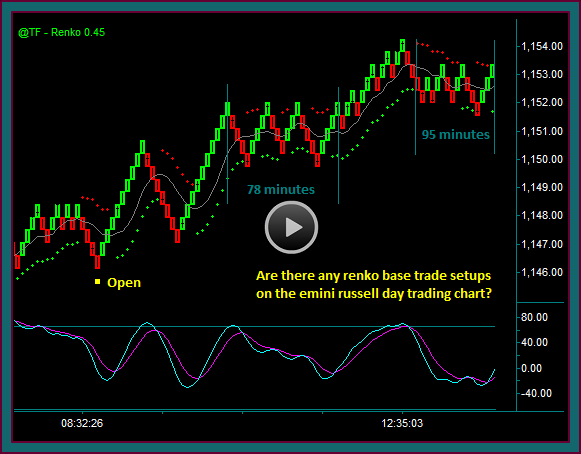
Let’s now look at this chart period on the renko chart and see if there is a synched sell setup, along with what the rest of the period looks like.
Would I take a renko chart trade that doesn’t show up on the tick chart? Yes, if there was continuation to a profit target in the trade – just like I would take a tick chart setup that doesn’t synch with a renko chart trade setup.
The point is to use these 2 charts in combination for further chart reading clarity – not only trade when there is a trade setup on both charts, although that would be my preference.
Renko Charts
- The renko chart shows the tick chart consolidation – and it the tick chart sell synchs with the renko chart yellow dot sell as a consolidation breakout with profit room to the low
I am not going to continue with the renko chart trades for the rest of the day, and then we will go back and look at the 240 tick chart again.
- The yellow circle is not our base setup – it is a mex cross extreme cross with a price envelop reverse, through the previous emini russell low as a support-resistance breakout
- And another example of trading the renko price envelope reverse mechanically, when there isn’t consolidation
- Yellow dot buy
- We have discussed this pattern as not exactly our renko base setup – but as a good trade setup, because of the triple break entry
- You can see this renko brick pattern at the top of the chart – and look at how it is chart read as a breakout setup through the blue line and the sell breakout, now as resistance
- You can also see what we have referred to as a double-triple top breakout – the 2 blue squares and the 2 purple squares show each of the previous double tops
- Yellow dot2 sell
- This is out renko chart base trade setup – you can sell the mex extreme cross and price envelope reverse, followed by the green midline reject brick and the red reversal brick
- This trade setup is even better, because it includes the failure of the yellow blue line
240 Tick Charts
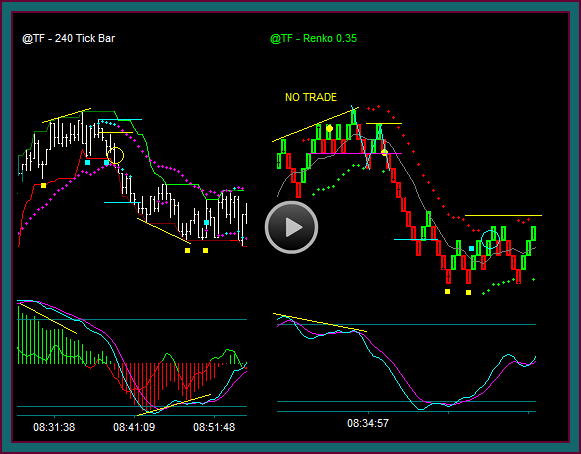
Now let’s look at the last 2 renko chart emini russell day trades on the 240 tick chart.
- If I was trading tick charts only, I would have a faster tick chart for timing to combine with the 240t – you remember this from the chat room trading days
- Let’s say a 120 tick chart was the faster chart – it would have done nothing but make the consolidation look worse
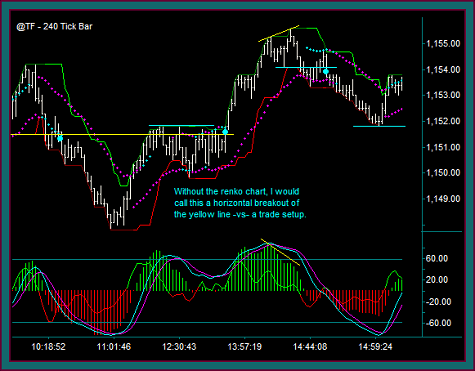
- I don’t know how to call this trade more than a horizontal breakout with room to a profit – I couldn’t call it a trade setup and don’t know what I would have done with the renko chart
- The blue dot sell is an easy chart read trade setup
- Pmd failure-pmd counterpoint failure break – with mex flow and the ttmf hook
- And there is a profit component back to the blue dot buy breakout area as support
So, that ends this video discussing my emini russell day trades for 1/3 and how the combination of renko charts and tick charts were used together.
I mentioned a combination of a fast and slow tick chart, like I have used in the past – in the next video, I want to show you this same trading day using a faster renko brick chart.
Be the first to comment