
You are looking at a renko trading chart and a bar chart combination for the same trading swing. The renko chart layout is very simplistic and the setups are often clearer to read than the bar chart setup, which is why they have been integrated into our trading method.
However, would you be more profitable by trading the renko charts or bar charts independently, or by trading them together as a combination?
But before I discuss that question and the chart combination further, I want to make some additional comments on our renko trading strategies:
- When you look at the renko chart, you have no idea for whether it is a futures day trading chart, or a stock chart that would be used as timing in position trading
- And I think that it is critical that our renko trading strategies can be used essentially the same way, regardless of what is being traded
- Think of this further in terms of what you are trading
- If you see that a video is about emini day trading, do you not watch it because you are a position trader or a trader that predominantly does short options trading strategies?
- That would be a mistake – these are all trading strategies videos, regardless of the specific focus
Without ever telling you what these 2 chart segments are, I could do the following video discussion:
- The timing for a short call sell to start or complete a ratio short options spread
- The timing for a long put buy to protect the long underlying in combination with the short call as a synthetic options short
- The transition of a position chart going from buy to sell – along with the exit of the position and the start of a new position
- The entry and management for a day trade
And regardless of what we were discussing – the trading method strategies would be best implemented using a renko chart and bar chart combination.
Renko Trading Strategies
Let’s start the trading charts discussion by looking at the renko chart only and considering the following questions:
- Of the 4 yellow dots, which ones are renko base trade setups?
- Of the renko base trade setups, which ones could actually be taken as trades?
- Of the renko trades taken, how were they managed?
- If you went short, would you still be short at the end of the swing, or would you be flat with a partial and a breakeven exit?
And would you understand, if I told you that I didn’t trade any of the yellow dots – but did go short, and was still short at the end of the chart?
Crude Oil Renko Chart Bar Chart Combination Day Trading
The underlying being traded is crude oil, with a renko chart 0.55 brick and .1 price envelope, along with a 3 minute bar chart.
Regarding these parameters, they have been working, but I also have a .5 renko brick chart up – and I would really like to find a good tick chart to use instead of the 3 minute.
Crude Oil Bar Chart
We may be using renko chart strategies for trade entry, but I always start with my bar chart to establish relevant prices and price action that are key to trading.
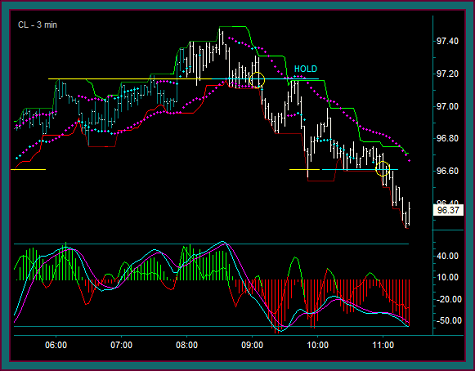
The crude oil day trade that was done, and the swing that we first looked at, goes from the yellow circle to the bottom yellow line:
- Do you see how important knowing price is for this trade?
- The price failure was the key to the entry – considering that this is a resistance to support shift line
- The same price then shifts back to resistance – and it was the key to still being short at the bottom yellow line, when there was that renko chart price envelope reverse
- And the bottom yellow line, which was left side support, was an excellent profit target – you can see the reaction when the line was tested
- When you see the reaction at the top price and the bottom prices, do you really think that you can best trade without know price – I know that I certainly couldn’t
The 3 minute stays in sell mode for this entire swing, with yellow circle2 being an addon setup. But this actually wasn’t the way this ended up being traded – let’s go to the renko trading chart now.
Crude Oil Renko Chart
Here is the renko chart, and the crude oil day trade went from the yellow dot to the profit target just discussed – but it was exited at the yellow circle instead of held.
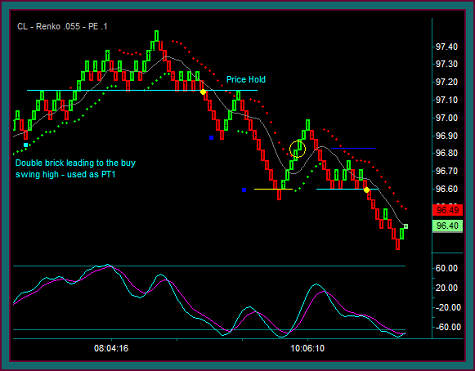
- This yellow dot was not on the first chart – with the renko chart and bar chart combination, I could see the way the blue line was being tested as support
- The entry came after the bar chart fast momentum hook and the break of the blue line
- Partial target1 was the left blue brick, which was a double brick retrace low that resumed to the chart high
- The trade was then held at the blue line resistance – regardless that there was a price envelope reverse
- Partial target2 with the yellow line left-right double bottom
- The entry came after the bar chart fast momentum hook and the break of the blue line
- And the trade was exited at the yellow circle – as a result of the double bottom reaction and the price envelope reverse
After the reverse, there was never a renko buy setup and crude oil went back into sell – and a price test of the yellow-blue line:
- Another renko chart crude oil day trade was taken at yellow dot2, timed with the bar chart and another fast momentum hook – with mex flow on both charts
- You got a better sense of the price action and consolidation testing support on the bar chart – where I did the renko entry on the break of the line
- The upper blue line was the initial risk for the trade – going above the consolidation high areas into the entry
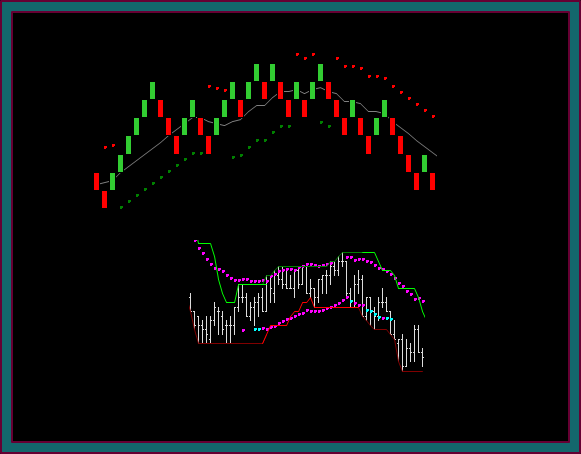
Renko Chart Trading Strategy Scenario
Now, let’s discuss this chart as if it was a renko chart and position chart trading combination:
- The position would be left side long and at the position chart pmd high-mex cross – calls would have been sold against the buy and to start a ratio call short
- Additionally, a long put would have been bought because of the extreme, to give synthetic options short protection for the long position
- The yellow dot synched with the position reverse – the buy would be exited and a short done
- If there had been a reverse only without a sell setup – the buy would be exited and there would be short participation from the short call long put options combination
- The sell swing went to double bottom support
- The short calls could now be spread off into a ratio call short
- Short puts could be sold against the long put to also have a ratio put short
The one difference, between day trading and position trading, would have been how the renko chart yellow circle would have been used:
- The position trade would have been held instead of exited – but the short would also have protection at that point from the last options trade done, which would have been the call buy-put short options synthetic long
So, that ends this video – and do you see my point about this being a renko chart trading strategyvideo, instead of being a day trading, options trading, or position trading video?
Be the first to comment