
We first looked at renko charts and a series of facebook trades that were profitable using them – but will renko trading charts also work with our trading method strategies for emini russell day trading?
That question is what we are going to discuss on this renko chart and emini trading video.
Emini Russell Renko And Tick Chart
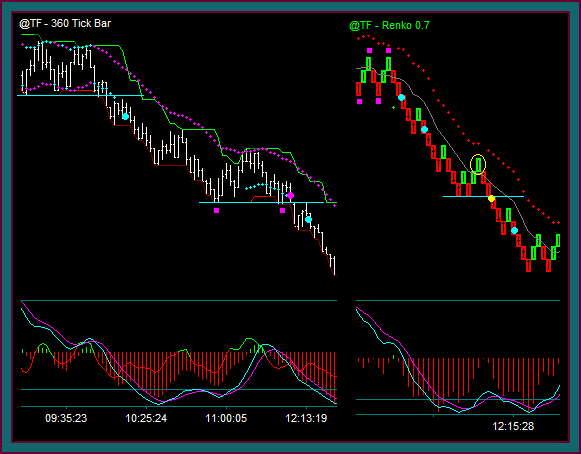
This first chart you see compares an emini russell 360 tick chart with our method trading indicators, to an emini russell renko trading chart, with a .7 price brick size – the trading day is 12-3 and the swing starts right around 10:00am ct.
Remember that the price indicators on these 2 charts are different. The tick chart has our direction channel indicator, and the renko chart has the new price reverse envelope indicator.
Before going through these 2 charts and comparing different points in the trading swing, I want to point out a meaningless dot shift on the renko chart.
Look at the blue circle around the green shift dot and the one on the momentum indicator. This is a typical problem with indicators and retraces, especially in a consolidation period, which is clear on the 360t chart. I also might mention that a slightly different indicator parameter wouldn’t show momentum as green.
The retrace to the top of consolidation takes the price brick above the midline and is enough to turn momentum green. On the other hand, the upper envelope has clearly been in sell and mex has good downward slope.
This is what I mean when calling this a chart read showing a meaningless reverse – this is also why our trading method won’t use indicators alone as trading signals.
Besides being aware of this, also note that since renko charts are intended to remove chart noise, consolidation periods that may be clear on a tick chart won’t have the same look on the renko chart.
Emini Russell Renko Chart Trade 1 And 2
Let’s start with the 360 tick chart and the blue circle-blue dot – the 2 blue dots on the emini russell renko chart are at the same time.
- The blue circle on the tick chart is a non-setup consolidation breakout
- If I was trading that chart, my sell would be at the blue dot as a first continuation setup
- Reverse into sell on the consolidation breakout
- Retrace to the blue line and the breakout support price that is now resistance
- Sell the shift-reject of the shift line with mex flow – we just discussed this trade setup in the price reject continuation trading video
- The renko chart makes a clearer pattern during this consolidation – do you see the purple squares and how it shows a double top-double bottom structure?
- Sell the triple break with the red envelope dots and mex flow
- The retrace-retest back to the midline area [shift line on the 360t] made a good continuation addon trade
- This synched with the initial sell on the 360t
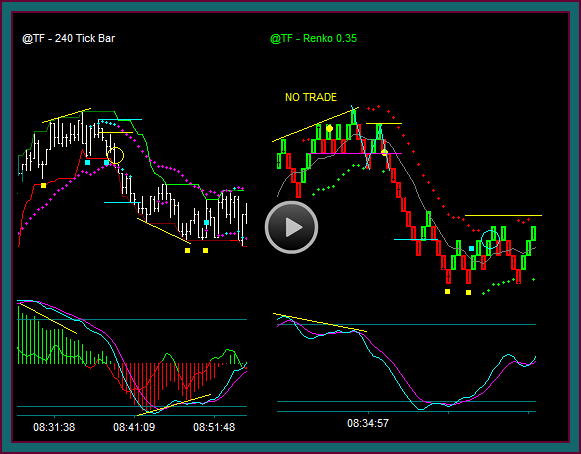
Yellow Circle – Yellow Dot
Looking at the yellow circle on the 360t, this is a trade that I would not considering taking:
- There is no setup past a channel breakout
- But it is a counter momentum extreme – that we chart read as being a trade into a price momentum divergence
Now look at the yellow dot on the renko chart – that is a trade setup that has become one of my favorite renko trade setups:
- This is the down sloping midline reject
- But the trade would be done as a momentum and mex extreme
- If I was only looking at mex and the renko chart, I am not sure what I might have done
- You will remember in the first renko trading chart and price movement video that I had removed the momentum histogram from the facebook chart
- Yes, mex is extreme – but at the time of the trade it is confirming the price lows and hadn’t begun to cross
- But with momentum and also looking at the 360 tick chart to get all the actual price highs and lows – this is a trade that I didn’t do
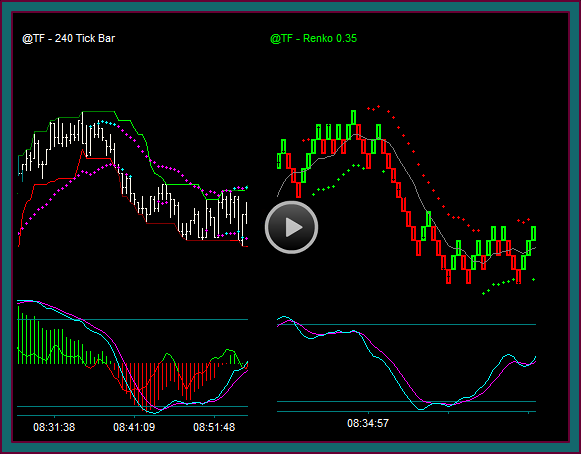
Yellow Circle2
The emini russell 360 tick chart did go to a pmd low, followed by a retrace to where momentum did flip green and the chart was very close to reversing – remember that we would need a dot shift to blue on top to get a chart mode change
- But even if the chart has shifted to buy mode – there still isn’t a buy setup there
- Using the tick chart only – I very well may have gone flat in this area
- Look at the synched area on the emini russell renko chart
- This was a far easier trade hold using the slope of the envelope channel that never shifted
- With the mex cross and midline break – I did decide to exit my sell addon
- If the initial sell was the only trade that was done – I think that I would have held it at that point
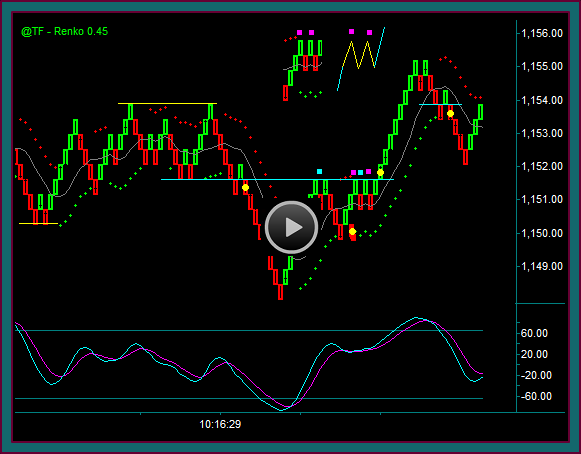
Emini Russell Renko Chart Trade 3
When you look at the 360 tick chart, can you see the resumption to the sell swing after that retrace from the blue line that crossed mex and took momentum green?
- I don’t like doing trades like this as a horizontal breakout of the lows – even with the triple bottom breakout
- And when I looked at the renko chart that was nothing that I could see as a trade setup
- But after the blue line support breakout – shift to resistance with mex flow
- I could take that sell as a swing resumption-swing continuation trade setup
- The trade synched with blue dot3 on the renko chart
- And I did this trade as an addon to blue dot1 that had always been held – it was the blue dot2 addon that was exited at the yellow circle
- The trade was with mex flow – but the retrace from the extreme was so shallow on the move to the yellow circle renko brick that it was crossing back below the extreme line
- I can’t say for sure what I would have done with the renko chart only, instead of also having the 360 tick chart up to trade with
- I do like this synched combination of the simplicity of the renko chart with the tick chart bars to give the prices and another view of the trading area
This was an excellent emini russell sell swing that has gone down a little more than 10 points without a reverse, over a 2.5 hour period. There were 3 trades taken, along with a 4th setup that I liked but didn’t do, because of momentum at the time.
We know that swings this size that don’t reverse aren’t typical, but they do happen – actually, the next day gave another sell that went down 17 points.
But that wasn’t the point of the video or my opening question – about whether we can trade our method trading strategies on the emini russell using renko trading charts.
With the strength of renko charts being trend following and removing price bar noise from a chart, they have worked well for our directional trading strategies and setups – including doing addons to the bigger price moves.
The key will be how these charts work during tighter swings or more extended consolidation and range periods, especially compared to the tick charts that we have always used. I want to see whether the renko charts will help keep us flat during consolidation [and this is for any underlying they are used for], while giving entries and showing the transitions out of consolidation.
Be the first to comment