
Our stock and options position trading strategies use a 60 minute bar chart for direction, with a renko trading chart for timing. And although we use a combination of price charts and renko charts for day trading, position trading uses the renko trade setups differently.
And in this video, we are going to discuss these differences, and specifically how the renko charts are used when position trading.
Here are some of the differences between position trading and day trading:
- In position trading the 60 minute chart determines direction and the underlying will only be traded in that direction, regardless of a renko chart trade setup
- Using the renko chart for timing means that renko setups that are with the position chart direction can be used for addon trades
- Renko setups that are counter to the position chart direction can be used for profit taking, and counter option trades
- NOTE: There are times when a position chart may have gone to a momentum extreme at resistance or support, followed by an mex cross – this is good timing to do an option sell
- And it may also provide a good position exit in the event of a renko base setup – you are essentially deciding that you don’t want to be in the position any more
- In this case the renko setup may be done as a day trade and held if the position chart also reverses
- In day trading the price bar chart and the renko chart are intended to be synched for direction and relative time span
- So the charts are traded together based on the sync –vs- only in the direction of a longer time frame chart
- All trades are directional and with either the renko chart or bar chart trade setup – counter options are not traded against the underlying
- NOTE: Depending on the underlying, and options trade may be done – for instance in the case of day trading apple computer
- But the trade will still be directional based on the trade setup – and done as an options synthetic trade, which can be a long or short trade
- A short call + long put is an options synthetic buy – a long put + short call is an options synthetic short
- NOTE: Depending on the underlying, and options trade may be done – for instance in the case of day trading apple computer
Renko Chart Use When Position Trading
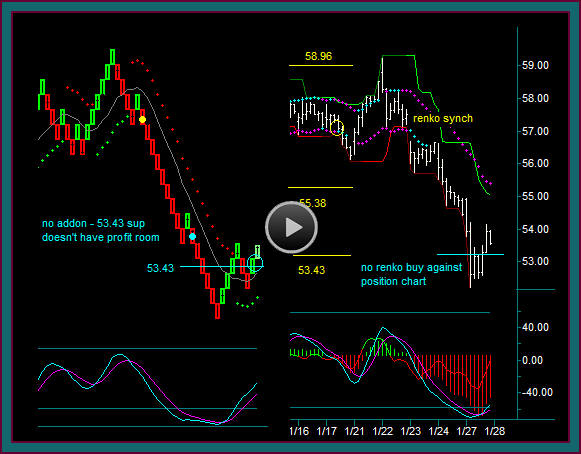
You are looking at a renko trading chart, and I am sure you can see a number of renko chart trade setups. But when this chart begins I am in a long position.
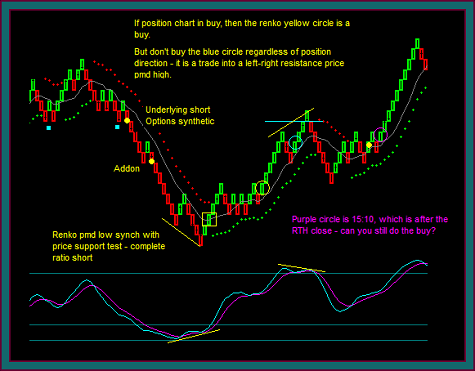
So how will these renko trade setups be used:
- Yellow dot1 – this synchs with the position chart reverse and becomes a very clear base trade setup for going short, including the triple break entry
- I am already short calls from the left side – but I also like taking a directional trade as a combination of an underlying trade and an options synthetic
- If the trade works, it helps with setting up a ratio options short – and if the trade doesn’t work a underlying trade only is still going to lose
- Yellow dot2 – we are in position sell and this is a base renko continuation setup and an addon trade is done
- Yellow square – swing continues down and goes to a pmd low support test
- Profit taking
- Complete options ratio short by selling put and buying call – against previous short call and long put
- Yellow circle – renko setup that includes triple break
- But this trade would be against the position chart – so no trade is done
- I exited the addon, but still quite away from resistance and a position chart held, so the initial sell is held
- NOTE: The last options trade is a synthetic buy, so that gives protection for the short
- Blue circle – the position chart is still in sell, but even if it was reversing at this point – you would not take this renko buy to go long
-
- This is clearly a counter momentum on the renko chart – and not only would be read as being into a pmd high, it would be directly into a left-right resistance price
- This resistance price is confirmed by the position chart
- Yellow dot3 – this synchs with a position chart resistance price triple top breakout
- The renko chart is in buy and has the breakout potential through the previous pmd
- Understand the sync with the position chart triple top –vs- what may be a double top instead of a pmd breakout
- Reverse the trailing short from sell to buy – with additional participation at this point from the short put-long call options synthetic buy
- Purple circle – as noted on the chart, this is around 15:10 and after RTH, can you still do the buy?
- I would exit the short and realize that I do have the synthetic long here
- If I did also buy stock, it would be a partial position because of the time of day – unless I had short calls that had not been spread off and needed the trading for protection
Twitter 60 Minute Position Trading Chart
I didn’t go through all the options math, but we have actually just done a twitter position trading update – from the position reverse on 1-27 through 2-5, which was the day of the twitter earnings release.
You are looking at the position trading chart and you can compare it to the renko chart we just discussed.
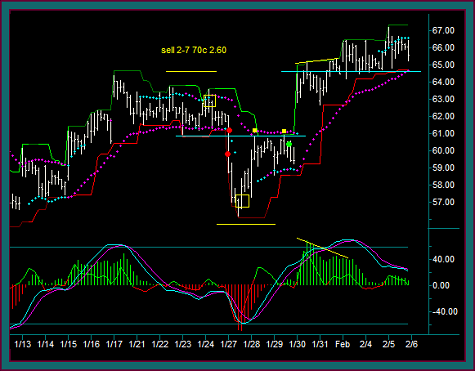
A few additional things that are notable include:
- You can see a pmd high and then a gap open above the pmd the next day – this was 1/31 and 2/3
- I would have done a pmd failure addon but the renko trade setup was on 1/31 into the 60 minute chart pmd high – and then there was no additional trade setup to do
- This was twitter’s first earnings release and I absolutely had no idea what to expect, in terms of protecting myself for the 2 ratio option short positions breakeven points
- I never intended to hold my long stock and went flat at 66.10
- Was I too cautious with closing the ratio option shorts, with the wide breakeven ranges they had – let’s do some math
- If I have a 7 point ratio call width for a $2.00 credit, then my breakeven is the 70 short strike + 7 + 2 = 79
- A 20% earnings gap up from the 65.55 close would be 78.66 and essentially breakeven and I just had no idea what to expect
- If I have a 7 point ratio call width for a $2.00 credit, then my breakeven is the 70 short strike + 7 + 2 = 79
- I was able to close the short call at 2.85 – so it was only a .25 loss that was more than covered by the long calls
- It was a similar situation for the puts, where the long put was a loser that was covered by the 2:1 short puts in the ratio
- Could I have stayed long a strangle = +call x +put for an extreme move
- Yes, but there was such a huge amount of implied volatility in the options that I could have lost on a moderate size move
That ends this video on position trading, using a 60 minute chart with the renko trading chart, for our stock and options combination strategies.
And as discussed, the trading position we talked about was for twitter, with all of the stock and options trades closed ahead of earnings.
Be the first to comment