
The stock option trading strategies for the Tactical Trading method are based on the following combination of trade types:
- Underlying or synthetic option trades that are done to capture directional price movement
- Options selling strategies that are done as counter trades for income and/or for directional trade protection
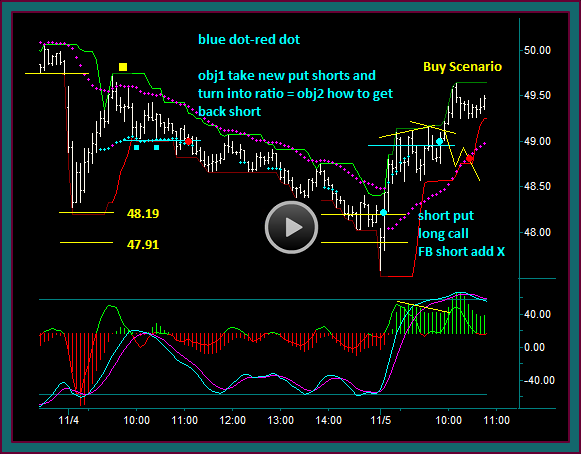
The Facebook trading video and chart discussion below goes over the setups for 2 directional stock trades, along with the entry timing for 2 counter option trades.
Of particular note is how this stock option trading strategy combination works so well together, consider:
- The short put long call is a synthetic long that protects the Facebook stock short
- If price continues to go up and the short is exited, which is what happened, the option synthetic makes you long instead of hedged
- If the move had continued to go down after selling the put, the stock short would cover that option sell
So, you can see how the combination strategies can protect the risk of option shorts and/or underlying trades – and our option selling strategies are further done in a way that reduces risk:
- The counter option trades are done in units of 2 shorts and 1 long. So, at the 2 blue dots marked on the chart there are 2 short calls and 1 long call, along with 1 long put and 2 short puts – these are ratio option shorts
- Trading into option ratio shorts like this, gives an option credit but at reduced risk than naked shorts only, because of the way the breakeven ranges to the shorts are increased
Facebook Stock Option Trading Strategy Chart Discussion
Let’s go over the different prices and trades marked on this facebook 60 minute chart that are discussed in the trading video.
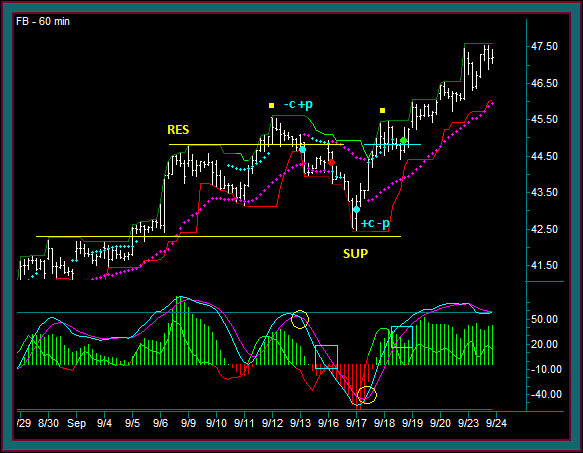
Resistance: Swing high that broke out to higher highs and then needs to shift to support to keep the swing resumption intact. When price breaks below the price again, it shifts back to resistance.
Support: This price was another swing high breakout. But unlike the resistance price line that didn’t shift to support, this price did – and is chart support on any retest.
Yellow Square: At this point in the trading swing, it is important for resistance at the previous high 44.80 to shift to support.
Blue Dot1: 44.80 doesn’t become support and when it fails to hold, coupled with the momentum extreme indicator cross [see yellow circle1] a call is sold and a put is bought.
This is a counter trade that will participate on a directional reverse, but it’s also a trade that would protect profits from a previous buy that was open – this is an important characteristic of this combination trading method.
Red Dot: You are looking at a method directional sell setup. Key components to this trade setup included:
- Resistance reject on retest after the initial reverse
- The reject is combined with MEx flow [see blue box1], which is a way we chart read momentum – we want it continue in the direction the trade will be on a retrace preceding the trade
Blue Dot2: Facebook sell has gone to support and held, along with a momentum extreme indicator cross [see yellow circle2] and besides taking a partial profit on the trade, a call is bought and a put is sold.
This is where the stock option combination trading method that has directional setups and counter setups works so well, consider:
- The short put long call is a synthetic long that protects the remainder of the Facebook short
- If price continues to go up and the short is exited, which is what happened, the option synthetic makes you long instead of hedged
- If the counter option trades were done in units of 2 shorts and 1 long, then you now have a ratio call short and a ratio put short
- Trading into option ratio shorts like this, give an option credit but at reduced risk than naked shorts only
Green Dot: This is a directional buy and shows another important aspect of the combination strategies and ratio shorts. Price moved past the call ratio short breakeven point, but the additional short in the ratio is covered by the long stock.
Key components to this trade setup included:
- Price resistance failure setup
- The entry is with MEx flow [see blue box2] – again you can see the retrace with momentum still going up
- The entry is into the 2 yellow squares triple top, which is a continuation breakout pattern
And when this trade did breakout to higher highs, again remember the stock option combination strategies – the short call was already covered by the long call buy off of support, but if it wasn’t this buy would have covered the short call.
Be the first to comment