This trading method training video is a strategy video, specifically discussing the question: Should you day trade by using a combination of renko charts and price tick charts and what I refer to as chart sync?
So, I don’t have any day trading charts to discuss; I am going instead talk further about the strategy of using both a renko chart and tick chart together for trading.
Ever since we began renko chart trading, I have discussed what I have called chart sync with a price tick chart, as a way of more accurately chart reading for price and market conditions.
But I also have received a couple of comments recently that have said that doing this complicates the method of renko chart trading. And this is fine, I am happy discuss aspects of our trading method further, which is why I wanted to do this video.
So, does renko chart and tick chart sync trading make the method more complicated to first learn – no doubt. But does it lead to more effective and profitable trading, when you get a chart read for real price, along with whether you would be trading inside consolidation – I would also say no doubt.
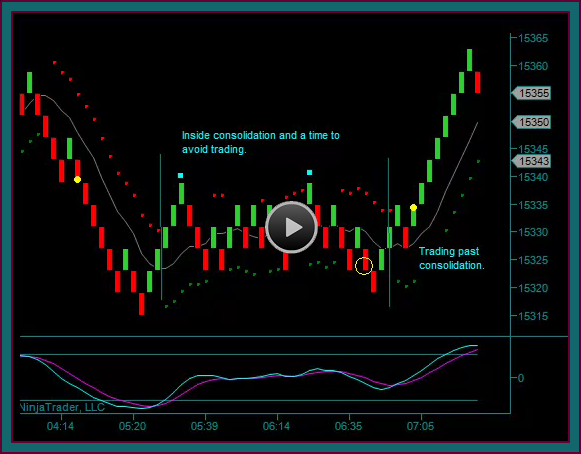
Those are the primary benefits for trading with the price tick chart – you can see important trading prices more clearly than from a renko chart, along with also being able to see consolidation periods better.
Renko Chart And Tick Chart Workspace
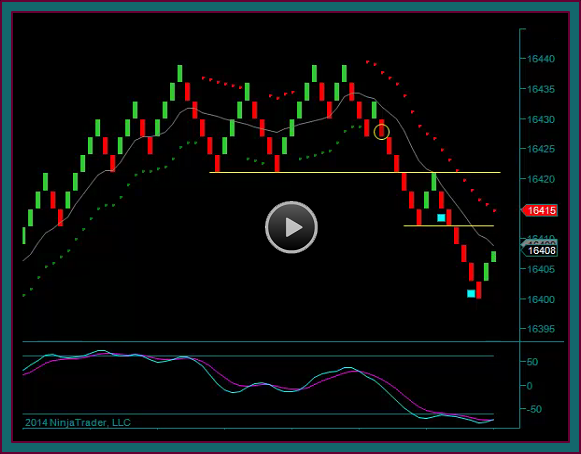
My trading computer happens to have 6 27” monitors, so having room for different workspaces isn’t an issue – what you are looking at is a drawing of a basic tick chart and renko brick chart layout for index day trading.
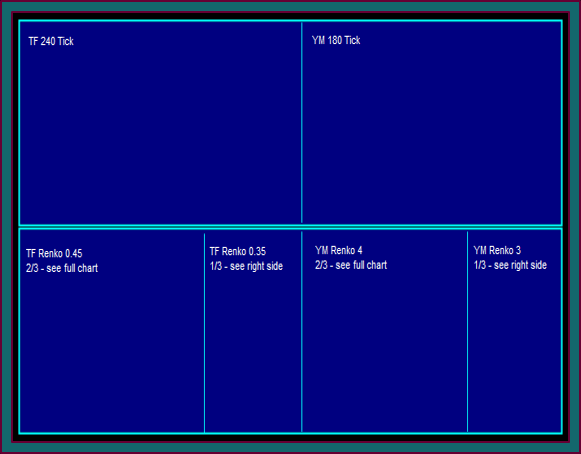
But you can see how simple is it to make a workspace that has a tick price chart on top of your renko brick1 and brick2 chart, and be able to read them together:
- Look at the price chart for its direction and momentum
- Look at the price chart for price and consolidation
- Look at the renko brick1 chart for base setups
- Knowing whether they are entered with a price failure component
- Knowing whether they are entered directly into a price point that eliminates the necessary profit target component
- Knowing whether they are entered inside of consolidation, when you want to avoid trading until there is a consolidation breakout setup
- Look at the renko brick2 chart for base setups
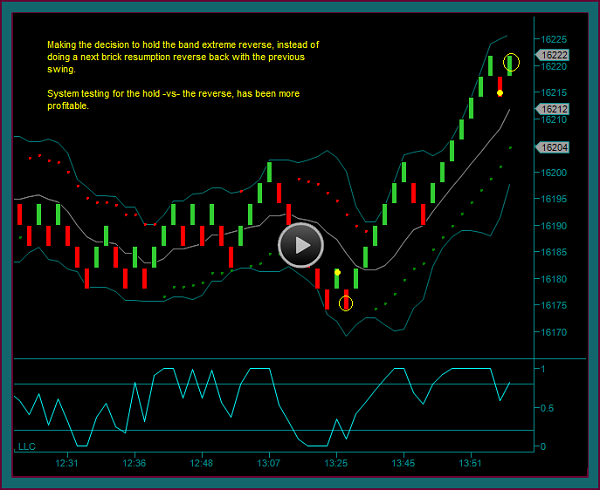
- This is done when renko brick1 has a price envelope reverse only
- This is done when you are in an extended swing and are looking for addon setups and partial profit taking
- The sync of the renko brick1 reverse followed by a renko brick2 trade setup is both effective and gives profitable trade setups that may not have been available
- Should we quit using the combination of 2 renko chart because it is more complicated – or is it just knowing price and market conditions that we should eliminate?
My basic day trading chart reading begins with the tick chart:
- Determine price points and directional swings –vs- consolidation periods
- Determine where momentum is in a directional swing – the tick chart does a far better job in showing price momentum divergences than a renko chart
- Determine where you are in the swing at the time of a renko reverse
- If I was going to eliminate something it would be to on trade renko base setups in the direction of the tick chart – and there are times that I do this
- There are times where the relative time of the tick chart and renko chart get ‘out of wack’ and because of this you lose directional synch – but that does nothing to real price
- I would likely take a renko base setup after a tick chart momentum extreme and mex cross, but before the initial reverse
- Or after a price momentum divergence mex cross – or a double top-double bottom mex cross
- If I was going to eliminate something it would be to on trade renko base setups in the direction of the tick chart – and there are times that I do this
- But I would not take a renko trade against the 180 tick when mex was still building and price was progressing to a profit target
Then after ascertaining the important chart information from the tick chart, I can focus on the renko chart for my trade setups.
I spend more time looking at the renko chart, because the tick chart is a quicker read, and most of my day trades are now renko setups.
And this is a function of the simplicity of the renko setups – but I would still say that the effectiveness comes from what I have learned and continue to learn from the price tick chart as we continue to move to the right.
Should You Day Trade Renko And Tick Chart Sync
But that is me and how I want to teach this method – with some additional possible complication to learn, but then leads to more effective and profitable renko chart trading.
I have been trading and teaching for 17 years, and up until November of 2013 had almost always day traded with tick charts. So of course that is something that is going to be included in the trading method.
You will remember that one of the first things that I mentioned about renko chart trading was that I wanted to add to the trading method and not change it – and that was after seeing the simplicity of the charts and how clearly what we have called a renko chart base trade setup can be seen real time.
But what should you do?
I would say that it’s common sense that if you only want to renko chart trade, then you should try it.
There is certainly plenty of renko chart trading training that is being done – and if you want to substitute how I use the tick chart for only things that you can find on the renko chart, then do it.
Trade the renko base setups as they come and ignore the price tick chart. And if you are satisfied with your profits and results, then you should continue to trade this way.
After all, it’s the end results that are most important. There is nothing wrong with adapting our trading method in a way that may work better for you – that is not what I would call ‘bastardizing’ the method and changing from a price momentum continuation method, to a top and bottom picking fading method.
But all this being said, it is also common sense to use study time to compare your trades to what the tick chart would have shown you.
If your results aren’t good, then chances are this will show you why. And if your results are ok, then chances are this will show you how to make them better – and progressing further with a combination of price and renko chart trading.
Be the first to comment