
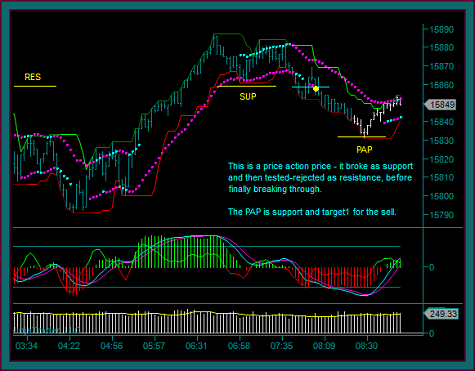
Price action prices and their identification is an integral part of our trading method strategies, because of the importance these prices have for trade entries and management. This is because these are price areas that gain significance, from the multiple times they may be tested and reject, along with being prices that have been both support and resistance.
The yellow-blue price line is what I refer to as a price action price. I am showing it to you on a renko chart, instead of a price bar chart, because I want to talk about it in the context of renko trading strategies and related trades.
You can see the price action that occurs here and why it is significant for trading:
- There is a triple break at the yellow line and the price then shifts to resistance
- When it is retested as resistance there is also a renko trade setup at yellow dot1 – but that trade should not be taken, because there is no profit component
- Resistance rejects and it is retested again – there is a break, but this is a test and it again rejects
- There is another resistance price test and another renko buy setup at yellow dot 2 – and again that trade shouldn’t be taken, because there is no room for a profit
- One more hit of the resistance price again rejects
- The price does finally break out, and now it shifts to support
These multiple tests and rejects are what I think of as price action and price action price significance. Identifying these prices when they occur is an important to our trading method strategies – in this case, especially for avoiding 2 losing trades.
Price Action Price Trading
We are looking at another chart with price action. It may not have had as many reactions as the first chart, but it was clear as a price action price:
- The price had broken as support and then tested as resistance, where it rejected and went to the lows you can see on the chart
- You can see the swing up where the price broke through, and then it shifted to support
- The price tested as support and rejected – and then there was a failure break setup at the yellow dot
- This is what we refer to as a break2 with mex flow, and left side diagonal breakout potential to a profit target
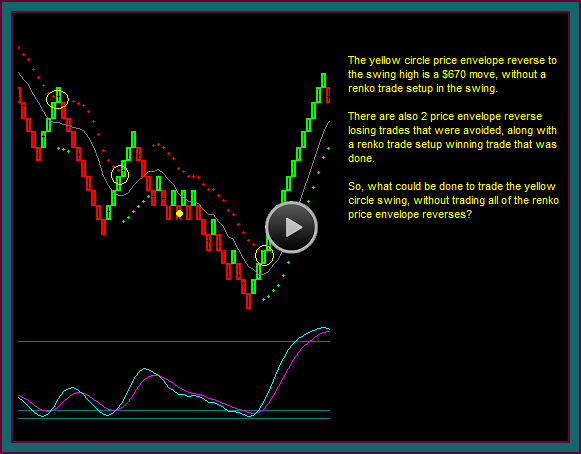
And what was profit target1 for the sell?
It was the price action price we discussed on the previous chart, and look at the test as support and how it rejected.
Now let’s look at the renko chart trading and how the price action prices were used, along with the renko chart trades:
- Yellow circle1 and the breakout of resistance never had a trade setup, but yellow dot1 was a continuation trade
- And unlike the buys that couldn’t be done, because there was no profit component – this trade was done at 15843, with 17 points of room to the 15860 target
- Similar to the buys that were avoided because of the resistance price action price – the yellow circle2 sell can’t be done, because it is directly into the support price
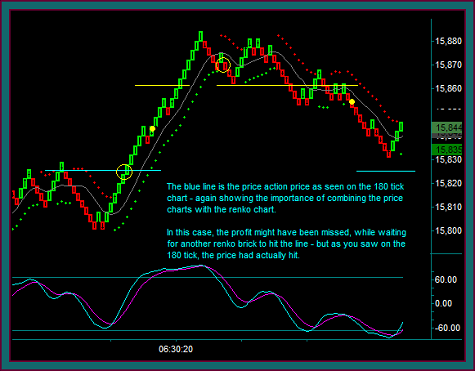
My actual trade was the 180 tick chart sell, because it was such a good price action price failure setup – but I do have to say it wasn’t a synched trade with this chart, because mex had not rolled back yet:
- The yellow dot sell would be the tick price chart and renko chart synched trade setup
- Mex had crossed again, with the price action price and midline reject
- This trade would have filled around 15853 and had a 21 point profit target at the 15832 support price
- Price hit 15831 with a mex extreme and the profit was gained
- Do you also see the importance of using the price bar charts with the renko charts
- If only the renko chart was being traded, then it is very possible that this profit would have been missed – because although price went to the support target, there wasn’t a renko brick that went there
This ends this video discussion on price action and identifying the price action prices, along with ways they are used in our trading method strategies – we just saw how the prices were used for: (1) avoiding trades because their location doesn’t have profit room (2) as a price failure trade entry (3) as a profit target (4) hold of an open trade.
Be the first to comment