
This renko chart training video is a follow-up to the ‘should you day trade renko and tick chart sync’ discussion. We are going to go through 2 trading periods and take a look at whether renko chart trading was improved by adding the tick chart, or possibly made more confusing.
I am looking at this more closely, because although I wouldn’t change for my own trading – I would be more than fine with saying that renko chart trading only is ok, if it really didn’t seem to matter.
Let’s begin with the renko chart, and you can see how the previous sell swing ended with a move into consolidation – and yes, this consolidation period should be clear on the renko chart only.
Now I have 2 renko chart questions:
- Was there a consolidation breakout setup for trading past consolidation?
- And if there was, how much profit giveback would you take from the last brick on the chart, while trying to reach your profit target at the yellow squares-blue line resistance price?
Renko Chart And Tick Chart Period1
(1) Here is the renko sync tick chart.
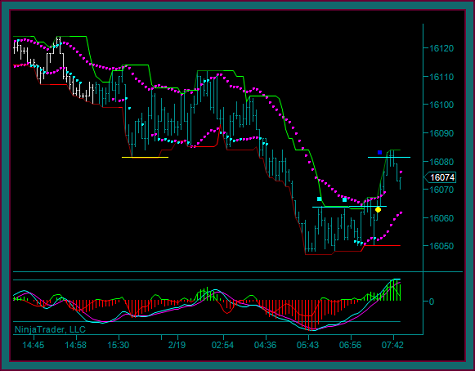
- No there wasn’t a renko chart consolidation breakout setup on brick1 or brick2
- But there sure was on the tick chart
- Buy 16063 as a break2 with mex flow – consolidation high triple top break
- The entry came from buying the break of the previous bar high 16061
- Additionally that profit target at renko 16087 was not resistance – resistance is the yellow-blue line real price resistance at 16081
(2) Price continuation to resistance 16081
- Partial1 at 16082 on the target break to 16084
- I didn’t try to extend the first partial further because this is shift line resistance
- Note that the renko chart only target has not hit
(3) The renko chart never reached its apparent target at the yellow line
- Tick chart partial1 at blue square1
- Partial2 at blue square2 and the double top then-green-red brick – also a clear double top on the tick chart
- Blue square3 was the exit on the renko price envelope reverse
- So, if there had been a renko chart buy setup – by waiting for the wrong target and not knowing real price, the trade would essentially have been a break even exit
- Renko chart yellow circle – is this a base continuation setup
- Yes as a 4 brick pattern – but definitely no trade, and I could have considered this as an addon
- But not directly into a double top at the shift line resistance price seen on the tick chart
Renko Chart And Tick Chart Period2
(1) Here is the renko chart that starts the 2nd trading period. Why was the yellow dot2 buy traded, but not the yellow circle sell or yellow dot1 buy – aren’t they all base trade setups?
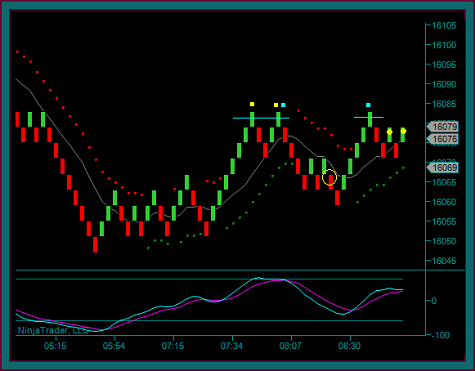
- Yellow circle1, as well as the red-green-red bricks before it, is directly into the day session open, and things can just get too choppy on the open
- Yellow dot2 is a base setup after the open – it is synced with the 180 tick chart
- The entry is a renko brick base setup pattern
- And I like that double-triple top breakout pattern for continuation
(2) Here is the 180 tick chart and why I didn’t trade yellow dot1
- Yellow dot1 is into the mex cross and I didn’t like that momentum timing
- You can see how we retraced back to the channel and the 2 blue square double bottom
- It didn’t happen, but this easily could have become a triple break reverse like the yellow line-yellow circle
- You can see the timing of the renko yellow dot2 buy
- And this is an example of not always trading with sync like I mentioned in the previous video – since the mex rollback hadn’t occurred
- But I have no issue with this being synced with the area of blue square2 and in sell mode – and I am comfortable with the breakout potential discussed in the renko trade setup
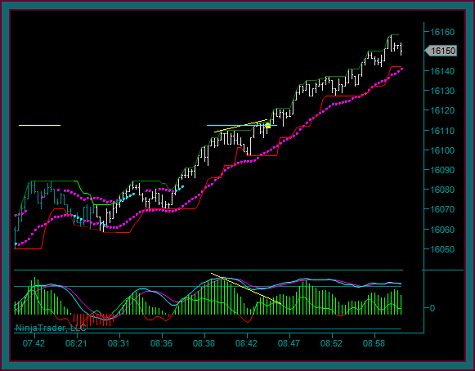
(3) The breakout was clean and accelerated to real price 16110 – is yellow dot2 and addon setup?
- It’s a renko chart trade setup with mex still flowing up
- But that is also an mex extreme that would quickly cross if there is no continuation
- Let’s look at the 180 tick chart and look at the momentum condition on it
(4) The 180 tick chart had already gone to a momentum extreme and a price momentum divergence high
- And I really did take a partial because of 180 tick momentum at 16108
- But the renko chart addon trade setup synced with the 180 tick chart pmd failure at the yellow dot
- Pmd failures are continuation trades
- And even better, this is also the failure of a left-right resistance price at 16112 – the renko chart didn’t show this price as the renko bricks only went to 16107
The addon was traded as described, and the 180 tick chart is still in rising purple square buy mode at the end of the chart – and was still in buy mode when the 16200 price high was hit.
That ends this day trading training video, again examining renko chart and tick chart trading sync. And I have to say that the renko chart trading was improved by adding the tick chart.
But what is really the most important is that overall trading was more effective by using both charts together than either chart alone.

Be the first to comment