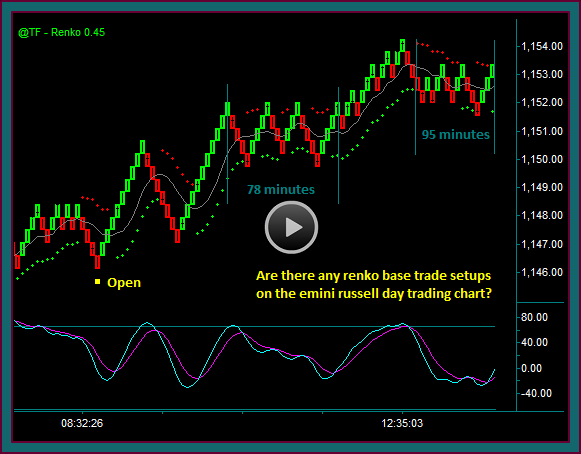
In this video we are going to discuss renko chart trading during periods of price consolidation, with a focus on the differences between trading inside consolidation -vs- past consolidation.
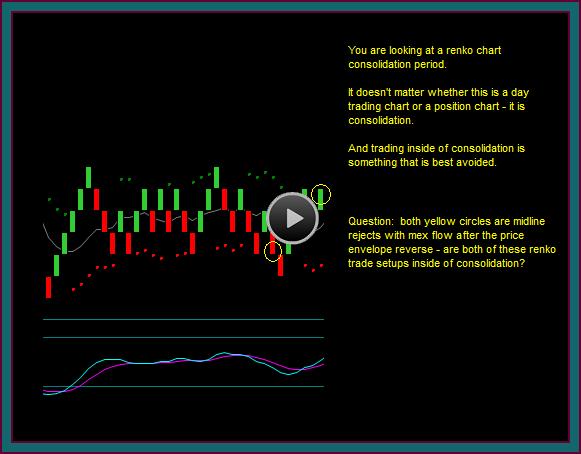
You are looking at a renko trading chart. But it doesn’t matter if it’s a renko chart or a bar chart, and it doesn’t matter if it’s a day trading chart or a position trading chart – trying to trade inside of consolidation is something that is best avoided.
You can also see the question we are going to talk at the side of the renko chart: both yellow circles are midline rejects with mex flow after the price envelope reverse, meaning that they have our renko base trade setup components – however, are they also renko trade setups that are inside of consolidation?
Trading Inside Of Consolidation
We are going to discuss emini dow futures day trading, and you are looking at the 180 tick price chart – but again, consolidation is consolidation.
The price move begins with a move down from the yellow line to the blue square – note that this is the right side of a pmd high counter point double bottom.
Price breaks through the triple bottom to the lows. And then there is a V reversal, which includes a price action move that shifts the blue line to support, followed by a reject and continuation to a double top high.
Move the blue line to the right as a relevant support price, as a result of the price action that occurs there, and note that a retest will be done as a double bottom.
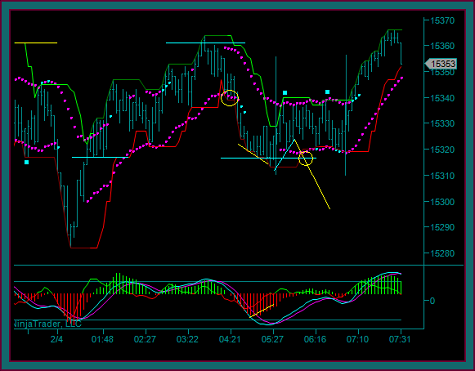
Yellow Circle1: Double top initial reverse
- That is not a trade unless there is a renko chart trade setup
- The blue line is profit target1, because of it’s a price action price – and must be watched as double bottom support
Profit Target1: The blue line hits to fill the first profit target
- After hitting the blue price area, it can’t break and becomes a price momentum divergence low
- After the pmd, we would be looking for a retrace – or a pmd failure like I drew, where yellow circle2 would be a continuation addon
Vertical Lines
- Getting a support or resistance pmd often transitions into consolidation
- You can see how this happens inside the vertical lines and the sideways consolidation between support and the area of the previous breakout
- There are no trades to do during this period, regardless of what the renko chart may show
- We end up getting a double top inside of consolidation and a breakout past the right vertical line
- Question: Was there a trade setup for the breakout – but if yes, would the trade have been done inside of consolidation?
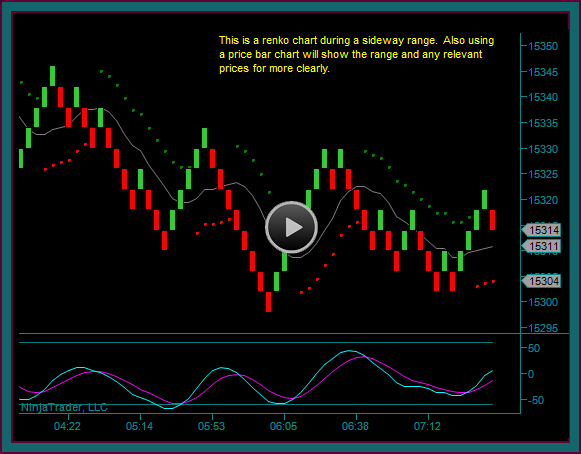
Renko Chart Consolidation Breakout Setup
Here is the renko trading chart and you can see the same vertical lines where the emini dow is inside consolidation.
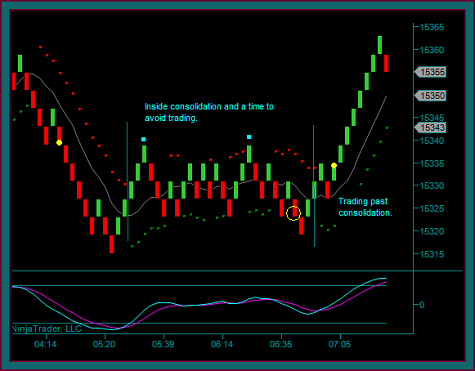
Yellow Dot1: This is the 180 tick chart initial reverse – this is a renko base setup synced with the initial reverse, and the trade was done
Yellow Circle: You may call this a renko setup with the 3 brick pattern midline reject with mex flow – but the trade would be inside of consolidation and not done.
Yellow Dot2: This is also a renko setup with the 3 renko brick midline reject with mex flow – and I did the trade because it is past consolidation
- And this answers my previous question – no, the right side breakout is not a trade inside of consolidation.
- Do you see the difference between trading inside of consolidation and past consolidation?
- The differences come from whether any possible setup is also a consolidation breakout setup –vs- a trade that has no reason to leave consolidation, meaning that it will continue to remain inside of the price consolidation range
- A 3 renko brick midline reject with mex flow that is also into a consolidation extreme triple top or triple bottom – is a consolidation breakout setup
- That is what we have at the yellow dot buy
- Compared to the yellow circle, which would be a breakout only – that was actually before the consolidation price extreme, as shown by the emini dow 180 tick chart
Consolidation periods are very difficult and there are plenty of them. They are boring and they can make you sloppy, and inevitably a trader tries a non-setup breakout only trade like the yellow circle [or worse] and very quickly lose.
And then what happens?
After there is an actual consolidation breakout setup like the yellow dot, the trader doesn’t trust themselves to take the trade – missing out on the profit from a real trade setup and the only trade that should have been done.
Don’t trade inside of price consolidation, regardless of the renko trade setup. Sure, there will be consolidation breakouts only that keep going, but the odds are that the trade will be a loss.
Be the first to comment