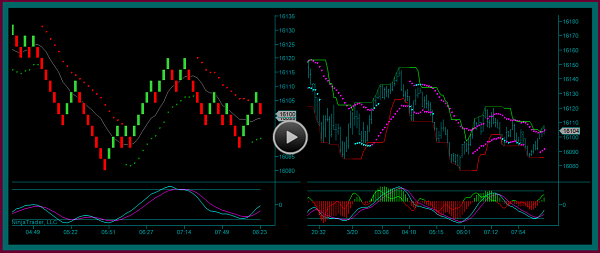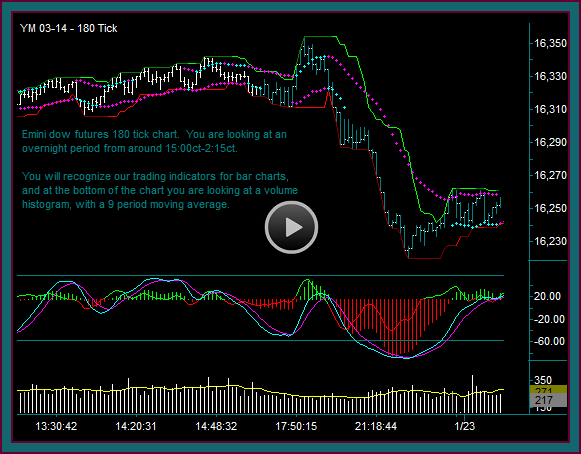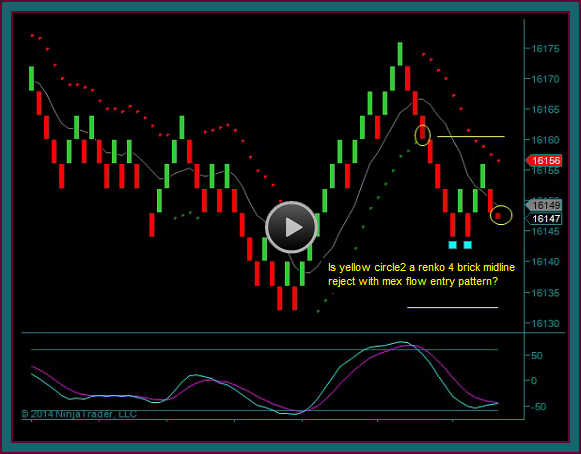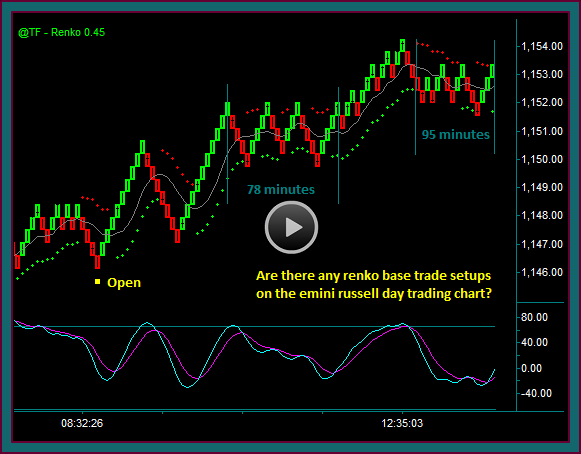
We are going to discuss emini dow day trading setups and trade management, by using renko chart and tick chart market replay. Beginning with the right side of the 2 charts, do you see the synced components for a base emini day trade setup?
- Yes, if we get a red midline brick followed by a green reversal brick
- With a fill of around 16105 and target1 at the channel high 16121 from the previous reverse
- But let me say that I don’t like trade setups like these – because I really don’t know where to price hold the trade
- So, I will take the trade if it occurs – watching the 16093 area, with the key being a quick breakout to the target
- This is why we care so much about mex flow build on a retrace – it does tend to lead to quick breakouts
- Long 16107 – entry on the 180 tick chart
Emini Dow Day Trade Setups And Management
(1) 16122 partial1 on the break
- I took the partial because of the open and didn’t want to worry about chop
- 16108 breakout area would shift to support
- 16148 next target
(2) 16129 partial2 on momentum extreme
- 16121 area shifts to support
- 8:31:07 – didn’t do an add because of momentum
(3) Sync chart setup
- 180t ttm –vs- mex flow
- Short 16116 on 16121 break
- Watch 16086
- Clear price initial risk using the lower high into the trade
- 16091 partial1 – 16083 partial2 – 16102 flat
(4) 9:00 buy – is there a momentum extreme?
(5) V reverse up after exit
- No trade setup to go long again – period ends with 180 tick pmd high
Question: With price testing the 16121 area that we have been using as an across the chart price AND doing so as a pmd high – what are your scenarios for the next emini day trade?


Be the first to comment