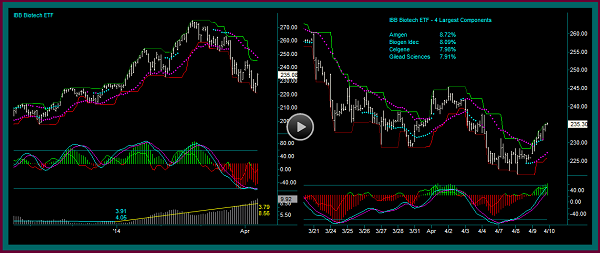
You are looking at a daily chart and 60 minute chart for the IBB Biotech Index ETF. And in this position trading video, we are going to discuss whether the IBB ETF is ‘suitable’ for our stock and options trading strategies, including short options trades.
We have been discussing our stock and options position trading method and the combination of using a 60 minute position chart and renko timing chart:
- Position chart for trading direction
- Renko chart for directional trade setups
- Renko chart for counter option trades
And while we have also been discussing whether a specific underlying could be used for our position trading strategies, we have seen the effect that volatility has on short options trading.
For instance, we know that stocks like Facebook and Yelp have worked very well for our combination trading method.
But we determined that although SPY ETF options trading was good for protecting a related stock portfolio, along with using long options spreads for directional trading – the SPY options volatility was too low to be used for our short strategies.
IBB Biotech ETF
To begin with, trading the IBB ETF would provide protection for a basket of related biotech stocks. The 4 biggest components of the index Amgen, Biogen Idec, Celgene, and Gilead, make up around 32.7% of the index.
Owning all 4 of these stocks, the IBB ETF has been important for overall position trading and protection – but what about trading the IBB with our position trading method?
If you will look at the daily chart and the bottom sub-window, you are looking at a 14 day average true range with a regression line:
- From 10/13 through 12/31/13 – the regression of the ATR is 3.91 to 4.05
- From 1/2/14 through 4/9/2014 – the regression of the ATR is 3.79 to 8.56
- The 14 day ATR for 4/9/2014 was 9.92
Looking at the April expiration options on 4/9, with a close of 235.08, we see the following for the at the money options:
- 235 call 4.90 32.95% MIV
- 235 put 4.90 34.05% MIV
Consider that as a straddle at a price of 9.80, and the implied range for expiration is between 244.88 and 225.28. You could go outside the range and sell a short 245 call-225 put strangle for around 4.00, and have a breakeven of 249 and 221.
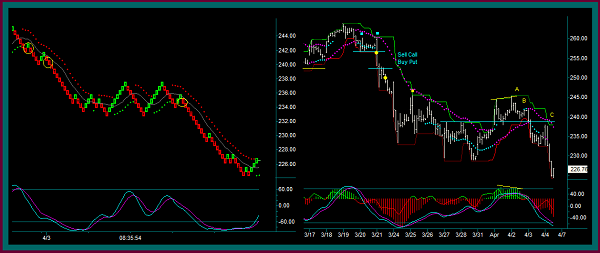
IBB Position Chart And Renko Chart
I told you in the previous position trading strategy video that I would tell you what the charts were of – as you can see they were IBB ETF charts.
I would say that this ETF can be position traded with our stock and options combination method. But there is one big problem – the ETF has a current price of 235.08.
So, as a result of the price being so high, stock trades are being done as options synthetics that are typically 1 strike out of the money. This is the way apple computer is traded, because of the high stock price – doing stock replacement trades with a delta of around 70.
The 2 yellow dot IBB trades were the following – if you get a 2 point move, you will have around a $140 profit:
- Yellow dot1 sell 260 call buy 250 put
- Yellow dot2 sell 255 call buy 245 put
I am not going to go back over all of the trades discussed on the previous videos, but I am going to talk about new trades at the areas marked A B C – you can see the renko chart sync at the 3 yellow circles.
(A) 4/2/2014
- Yellow circle1 sync
- Sell 4-19 255c 1.60
- Short option – leave the 250 strike open for protection
(B) 4/3/2014
- Yellow circle2 sync
- Sell 4-19 245c 3.00
- Buy 4-19 235p 4.20
- Stock replacement trade
(C) 4/4/2014
- Yellow circle3 sync
- Sell 4-19 245c 2.55
- Short option – leave the 240 strike for protection
- We will talk more about the math of this trade in another video – but with short 255 calls and 245 calls, 250 calls could be bought to create an options butterfly
- Sell 4-19 240c 4.00
- Buy 4-19 230p 4.30
- Stock replacement trade – addon to short synthetic from B
I am going to end this video here, with the position as described – we will go forward and discuss these trades further, including turning any of the synthetic short into spreads, along with any possible put sells.
Be the first to comment