When we ended the last yelp stock and option position trading video update, I said that I wanted to do a short options strategy basics video that discussed (1) starting the trading position with a short option (2) using a stock trade to protect the short options.
Let’s start by discussing short options strangles and the difference between using counter timing strategies for entering a short option leg –vs- entering the short strangle at the same time:
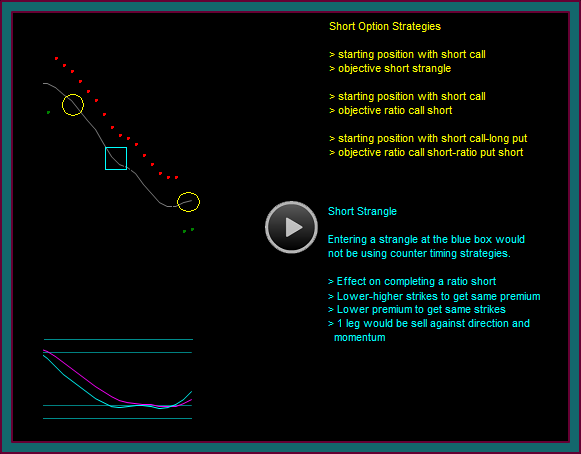
- Think of both of the yellow circles as renko trade setups
- Yellow circle1 renko sell – sell call 1.50
- Yellow circle2 renko buy – sell put 1.50
Short Option Trading Strategies
There are 3 basic short option strategies, which differ based on your completed position objective:
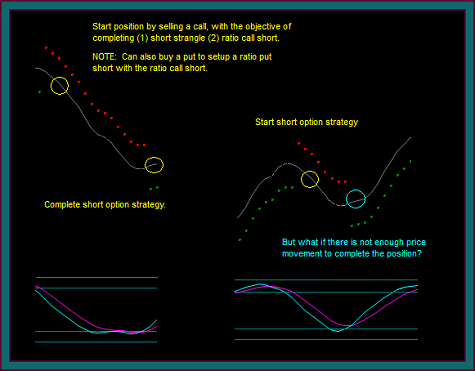
- Starting a position with a short option, with the objective of selling another short option to complete a short strangle
- Starting a position with a short option, with the objective of spreading this off into a short ratio option spread
- Starting a position with a short option-long option synthetic trade, with the object of spreading this off into 2 short ratio option spreads
A short strangle would be completed with a higher credit than a ratio short. However, I tend to prefer the ratio short spreads, because they have lower risk, along with more trading position flexibility when combined with stock trades – and they also have a greater profit potential, because they can make more money than what the options are sold for.
For a trader that wants to only do short strangles, I can be fine with that if they would do short option position stock trades when necessary.
Short Option Trades Position Graph
You are looking at the position graphs for a short strangle compared to a short call and short put ratio spread, using the 2 yellow circles on the previous chart as entry timing:
- Short strangle
- Sell 50 call 1.50 at yellow circle1 – sell 45 put 1.50 at yellow circle2
- Maximum gain = 3.00 , which is the sum of the short option credits
- Breakeven = 53.00 to the upside and 42.00 to the downside
- Short strikes +/- total credit
- Maximum loss = 1:1 with the underlying above or below the breakeven points
- Short ratio spreads
- Sell 2 50 call 1.50 and buy 1 47.5 put 1.00 at yellow circle1
- Sell 2 45 put 1.50 and buy 1 47.50 call 1.00 at yellow circle2
- Maximum gain = 6.50
- The maximum gain occurs at the short strikes
- The gain = strike width + total spread credit
- 2.50 width + 4.00 credit
- Breakeven = 56.50 to the upside and 38.50 to the downside
- The breakeven is the short strike +/- the width of the spread +/- the total spread credit
- 50 + 2.50 width + 4.00 credit = 56.50
- 45 – 2.50 width – 4.00 credit = 38.50
Short Options Selling Timing Strategies
The basic timing strategy for all of the short option strategies is essentially the same.
The timing to start this position comes after a directional swings [ideally to resistance or support] that is followed by a counter renko setup – meaning that it is before the position chart reverse.
Now compare this to not using entry timing, but simply selling your short strangle at the same time – for instance, at the blue square –vs- the 2 yellow circles:
- There is a big difference on the risk-reward between the strangles
- If you want to use the same strikes as the yellow circles, then you will have to take a smaller premium for the option sells
- If you want the same premium as the yellow circles, then you will have to sell a lower call strike and sell a higher put strike
- You will be selling one of the options against direction and momentum
- For instance, the put sell at the blue square would be against directional sell mode and while mex flow was still building to the downside
- The short put may actually be in the money at the time a short put would be sold at the yellow circle
- But in any case, there is better odds for downside continuation at the blue square than there would be for a retrace or reverse
- It will be more difficult to complete a ratio short spread, because you are entering at a location that is closer to the price you would complete the spread
- Look at the difference at selling a call at yellow circle1 and buying a call at yellow circle2 – compared to selling a call at the blue box and buying a call at yellow circle2
Short Option Position Protection
So, as a trading basics video, those are the short options strategies using entry timing.
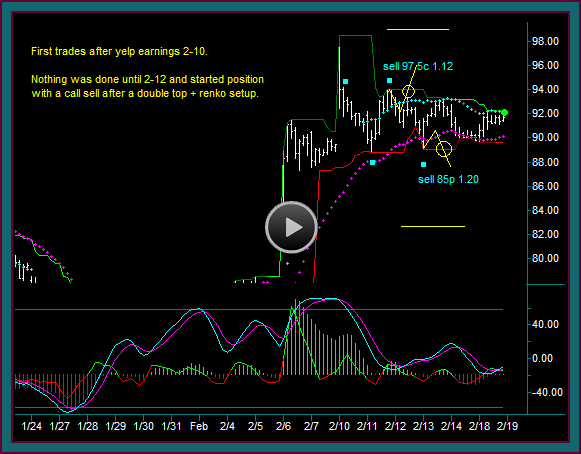
Here is the chart that we will use in our next video, along with updating yelp from the previous video and this closing position:
- Short 97.5 calls 1.12
- Short 85 puts 1.20
- Long stock 92.10
I need to get updates done for facebook, but I think you will find that yelp is far more interesting, since I got ‘hosed’ on one of my trades 😛
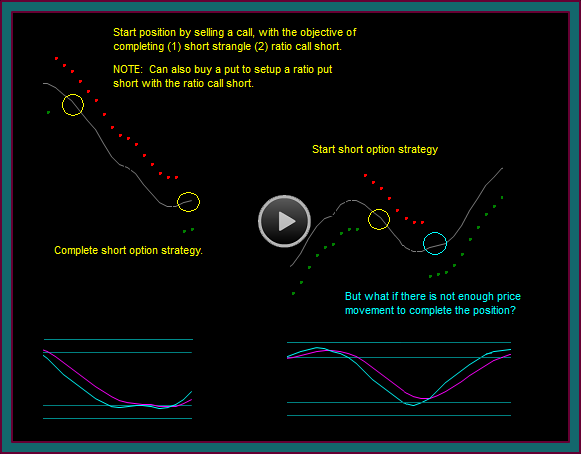
Regarding this chart and a critical question for trading short option strategies: What if you start your short strategy at yellow circle1, but instead of going to yellow circle2 and completing your spreads – you only go to the blue circle and reverse right back into buy against the short calls you just sold?


Be the first to comment