
We are going to discuss emini russell futures day trading, with additional focus on trade management, especially for the initial risk and profit target location.
Trade management is always a critical aspect of profitable day trading. And this has become additionally important to discuss, now that we are using the emini russell renko chart and tick chart trading combination.
There are some trade management differences to consider using renko bricks, when compared to trading bar charts only. Additionally, I am now using a slower chart combination for the emini russell.
I am going to cover this in 2 videos, where we will first focus on setting initial risk and profit target points on a renko chart, and then where we will discuss the trade management for some specific trades that were done.
Some of the things we will talk about in video 1 include:
- The tick chart and locating price points that are important to use with the renko chart
- Should trades only be taken using the renko chart setups
- Any tick chart trade setups, if it is determined that it isn’t necessary for the setup to come from the renko chart
- Trade management when trading from the renko chart
And then the 2nd video will discuss the related renko charts and trade setups, along with talking about the initial risk and profit targets for the trades.
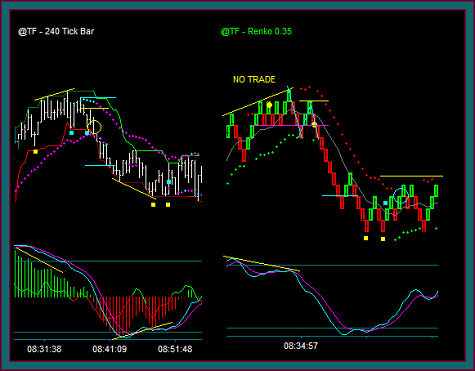
Renko Chart And Tick Chart Trading Combination
Trading was done with a multiple chart combination of the 240 tick chart and a renko chart – you are looking at a combination of the 2 charts from the open until around 8:55ct. You know that the intentions of mixing chart types is intended to give a better look at the market being traded:
- The tick chart shows us real price, which is always necessary for trading – and this is especially the case when also trading from a renko chart using a fixed brick size
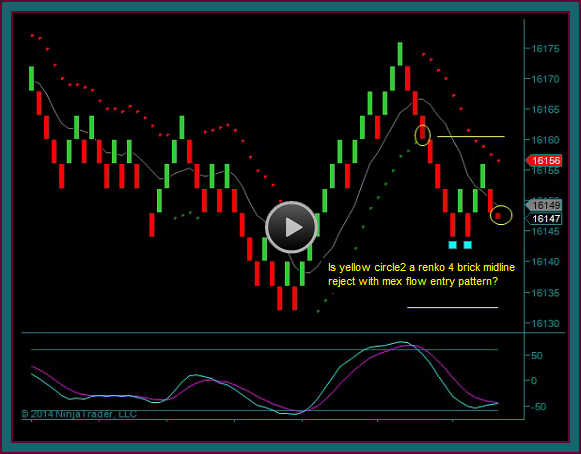
- The renko chart and the price envelope reverse-midline reject with mex flow trade setup is a high odds trade setup that is typically clear to see real time – and often far clearer than tick chart trade setups, which is why it has been added to our method
But this has led to some additional questions that I want to further address in this video, while discussing the trades:
- Can tick chart setups be traded that aren’t also renko chart setups?
- What is the stop amount and profit target amount when trading from the renko charts?
To begin with, you can absolutely trade that tick chart setups and the renko chart setups, regardless that they don’t occur on both charts at the same time.
The purpose of the combination of both charts, with regards to trade setups, is to give us additional trade setups. For instance, what if there is a tick chart initial reverse-renko base setup combination?
If you were only trading the tick chart you likely wouldn’t have had an actual trade setup. And the same situation could occur with a renko chart price envelope reverse-tick chart trade setup combination.
In both cases, I would take the trade. What I don’t want to do is take a renko trade setup that is directly into support or resistance as shown by the 240 tick chart. Just like I don’t want to take a renko trade setup that is counter momentum on the tick chart and thus read as being a trade done into a price momentum divergence.
Renko Chart Stop Amounts And Profit Targets
The question about stop amount and profit target amount, with the renko charts, is not as easy to answer. But I will start by saying that these amounts are based on price and not chart type – and another reason why we are using the 2 charts in combination.
Trade Entry Initial Risk
When we take a trade, we begin with an initial risk amount. But this is not a set stop amount that we use on all of our trades, it is based on the price area above the lower high into a sell and below the higher low into a buy.
This is why we are most comfortable with setups that have the retrace, with mex flow continuing in the direction of the trade:
- It locates the area of the initial risk for the trade
- It ensures that the trade is being done with momentum
- It typically gives us a relatively quick move right after the entry, especially when the trade setup includes the failure of a price that should be support or resistance
- These are all in contrast with taking a trade on the initial reverse
- The initial reverse certainly may have left side diagonal breakout potential
- But it will be far harder to have a price to use as initial risk
The one thing that I want to point out for sure – don’t use the renko brick high or low that was the midline reject as your stop amount, you will be stopped out of a high percentage of trades.
Do you remember that triple break M breakout pattern that I have shown you and drawn on charts a number of times?
That trade setup includes 2 midline rejects. But if you had actually entered the trade on the first reject, the retrace to reject 2 would stop you out of the trade – right into a very good breakout pattern.
We want to locate a real price from the tick chart and not a brick high or low, when looking for the initial risk location.
And I will further add that you want to use real price when trying to hold a trade on a retrace. There is nothing more frustrating than going flat, just to realize that you exited basically at support or resistance and it held and the swing resumed.
So, before using the renko chart price envelop reverse as an exit, first look at your tick chart and locate the relevant price point in the area.
All of this being said, I have found that my initial risk since shifting to the 240 tick and renko chart combination, has tended to be in the 1.20-1.50 area.
And with regards to holding retraces, this is also a function of trading size and taking partial profits. For instance, entering with 3 contracts and getting 2 partial profits has a lot more profit giveback tolerance than only trading 1 contract.
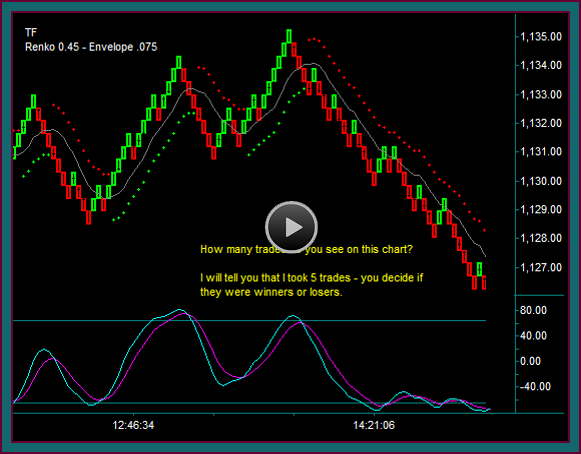
Trade Profit Targets
My trade profit targets first come from what I have called a base partial. You will remember from the 48 tick-110 tick chart days that I viewed 10 ticks as a base partial profit.
But you will also remember that was a target amount, instead of a fixed amount entered when the trade was taken – and it was an amount that I tried to extend.
Here are a number of factors used for partial profit taking:
- Where is real price as a target
- I might have taken a trade with a price target 8-9 ticks away and decided to take a smaller partial profit
- Does the chart have left side diagonal breakout potential and to what price point
- This is the best way to extend the profit size
- I remember plenty of times where there was diagonal breakout potential for 2-3 points and the trade went straight through it – giving a 20-30 tick partial profit –vs- the 10 tick base amount
- What is momentum doing
- I might have a profit target 15 ticks away but there is a momentum extreme or a double top-double bottom first
- I will take a partial profit before the target
- Watch previous price action areas – meaning the prices where there were retrace-rejects into price continuation, or price breakout areas that continue
- This would be important for selecting price targets, along with holding trades and initial risk areas
- You wouldn’t want to exit a trade in the center of a price action area, because they are too likely to test and retest – and those tests really don’t mean anything
- This would be important for selecting price targets, along with holding trades and initial risk areas
Now with the slower tick chart being used, leading to a bigger initial risk amount – the profit target amount has also increased. I am finding my first partial profit to be in the 1.50-2.00 area.
I don’t mind starting with a target that is similar to my initial risk, for a couple of reasons:
- A win:loss ratio that is greater than 50%
- A trade profit that often includes a 2nd partial profit before an exit
- A loss size that is usually smaller than the initial risk amount
Renko Chart And Tick Chart Setups And Management
So, there is some insight for trading the renko charts and tick charts together in terms of taking trade setups from both charts, along with trade management for initial risk and profit targets.
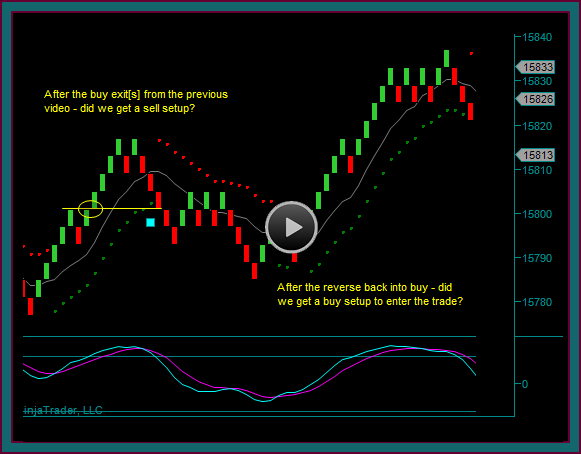
Finishing the discussion for this first trade and the initial risk and profit target:
- Initial risk is the blue line we marked above the lower high brick into the sell at 1152.40
- The trade was entered at 1151.30
- Initial risk is 11 ticks
- Profit target1 is the next blue line – where did it come from
- It was a price action area from the previous day
- Price stalled at the are and consolidated – and then it broke and shifted to resistance
- And there was a big swing continuation
- The price 1149.50 – or 18 ticks for profit target1
- This was actually taken at 1149.30 or 20 ticks
- So the initial risk was a little smaller than the average and the profit target was at the high end of average
Be the first to comment