
Our position trading strategies for stocks and options are a combination of 2 trading methods: (1) stock trades using our trading method setups for direction and continuation (2) options trades that are counter direction, using timing strategies for trading at points where a swing reverse could occur.
This video will begin discussing stock and options combination trading basics, starting with a simple 100 share stock buy setup that is then followed by a call sell and put buy at a price resistance and momentum extreme.
And then after the basics are covered, new videos will discuss more trading strategies, including setting up ratio short options spreads.
Position Trading Strategies Beginning With A Stock Buy
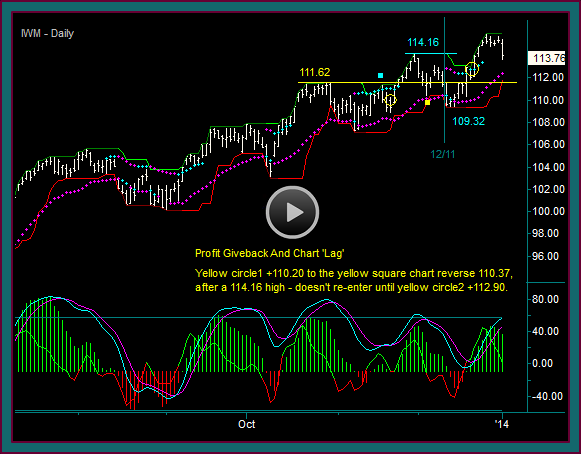
To discuss the trading strategies basics, we are going to look at a chart with the renko price envelope but no renko bricks. And looking at the chart, you can see circles labeled directional trade – what is a directional trade?
In our trading method we take trade setups consistent with the direction [what I have called chart mode] that the chart shows, looking for price momentum and continuation in that direction.
A counter direction trade would attempt to pick a top or bottom and need a price reversal against direction to be profitable –vs- price continuation with direction.
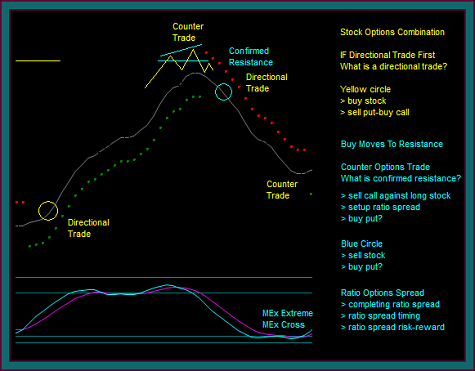
You can see on the chart at the yellow circle that we are beginning with a buy:
- Buy stock
- You can see the price envelope reverse and mex flow – envision that the yellow circle is a 3 renko brick midline reject
- Buy call–sell put – this is a synthetic options stock buy
- NOTE: we will be discussing strategies for doing synthetic options instead of stock and in combination with the stock, along with selecting strikes and expirations
- But for right now we are going to discuss a stock buy at the yellow circle
- Buy stock at 50.00
We are long at 50.00, with chart resistance at 55.20 at the yellow price line. Price moves to resistance and we get a pmd high at 55.60 that is followed by a mex extreme cross:
- Now we are doing a counter trade – why is it counter?
- Because it will be against chart direction – essentially using a timing strategy as if we were trying to pick the top
- But we are also using the resistance pmd high-mex extreme as a combination that frequently leads to a reverse
- However, unlike taking a counter trade as a stock sell reverse – we are going to sell a call option against long stock
- NOTE: the best timing for counter options is when we have confirmed resistance [or support]
- With a pmd high-mex cross at resistance, there is still the possibility of a pmd failure and price continuation
- For confirmed resistance, the pmd high-mex cross would be followed by a lower high that also rejects resistance – you have heard me refer to this as a crown pattern
- You can see the pmd high and confirmed resistance drawn on the chart
- NOTE: the best timing for counter options is when we have confirmed resistance [or support]
- The confirmed resistance short call options sell should be used when the position is starting with the counter option trade, instead of the directional stock trade – because the odds of a reverse have been increased
- In the case of our trade example, we can give up some of the timing for the math of the trade
- Meaning that a long stock-short call combination is a covered trade –vs- starting with the short call first and having an uncovered trade
- Yes, I would still like the confirmation, but the earlier entry would allow for a call sell at a bigger premium or at a higher strike price
- Sell a 56.50 call .90 after the 55.60 pmd high, at a stock price of 54.90 [after the 55.20 price break]
- NOTE: Once the call is sold, there is a cap on the stock profits – this occurs at the short strike + the call credit = 56.50 + .90 = 57.60
- The expiration for the call is 11.50 days
What about also buying a put?
- Timing tradeoffs
- If we buy a put now and there is a pmd failure – we will have reduced the size of our call credit by the cost of the put unnecessarily
- On the other hand, if there is a pmd high followed by a swing reverse – we will have paid less for the put, since it was bought at a higher stock price, and we will have hedged a larger portion of stock profits before the reverse
- Since a pmd failure is a continuation setup for this method, I typically will wait until there is confirmed resistance before also buying the put
- I will have some additional stock profit giveback before the short call-long put [synthetic stock short] hedge, but this would be offset by the number of times there is a pmd failure
- NOTE: I said typically
- An example of where I would sell the call and buy the put together would be if I was long after the reverse of a bigger previous move down
- And this resistance was a support-resistance shift line, from where the sell swing last broke down
- I would want the additional protection in that case
- Why – because I just gave you an example of greater odds for the swing reversing
- Buy the put after confirmed resistance
- Buy a 53.50 put .60, at a stock price of 54.30
- The expiration for the put is 4.50 days
- Buy a 53.50 put .60, at a stock price of 54.30
- Why sell a call with 11.50 days to expiration, but buy the put with 4.50 days
- The closer expiration makes the put buy cheaper
- By buying the put the stock profit cap is lowered by that amount – the 57.60 profit cap has now become 57.00
- So, we want the put strike as high as possible, with the put cost as low as possible, because that will give the most stock protection along with the smallest profit cap
- By buying the put the stock profit cap is lowered by that amount – the 57.60 profit cap has now become 57.00
- The closer expiration makes the put buy cheaper
NOTE: These expirations and using weekly options are typical for our facebook, yelp, and twitter position trades – I would use more time to expiration if this was a position intended to be held longer
- By waiting for confirmed resistance, the odds of the reverse have increased – and thus wanting more protection for the long stock
- NOTE: We are not doing complete hedges – to do that, we would need to buy a put that was the same strike as the current price of the stock
- That would essentially be a -100 delta trade against a +100 stock trade
- Our short call-long put is -71 delta – so it is around a 70% hedge
- This is known as an options collar
- It will protect a large percentage of the stock giveback to the area of a reverse – while still giving more room for profits if there isn’t a reverse and the buy swing continues
Stock And Options Position Profit Graph
Let’s now look at the profit graph for the combination of stock and options trades that were made.
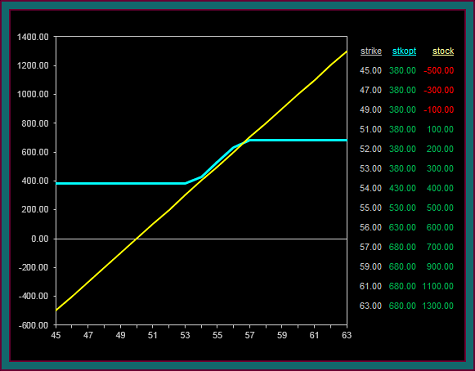
- The left column is for strike prices at expiration and what the stock and option position profit will be
- Since we do have split expirations our numbers will be off some, but the profit curvature should be the same
- The yellow line and far right column is the original 100 share stock buy at 50
- You understand that for every point the stock goes up you make $100 and for every point it goes down you lose $100
- The blue line and middle column shows the profit for the stock and options combination position
- You can now see that you have a position that will gain a minimum of $380 and gain a maximum of $680
- This is the tradeoff for doing the options collar – to ensure that the trade will be profitable, you have to give up upside potential
I have no problem with these tradeoffs, because of the timing strategies used for doing the options trades and the odds of a reverse. And if there is continuation, chances are there will be an addon setup to use that will again give uncapped profit potential.
I also like knowing that if there is a reverse without a trade setup, the short call-long put is a synthetic short stock position.
That is the profit graph that you are now looking at – as if the long stock was exited at 53.70:
- The yellow line is the profit graph of a short stock position at 53.70
- The blue line is the profit graph for our short call-long put after the stock is exited at 53.70
- When you see how much better the risk-reward for the options trade is remember that includes the profits from the stock buy
This next profit graph compares our options synthetic with the stock short – why does the options trade still have a better risk-reward than the short stock?
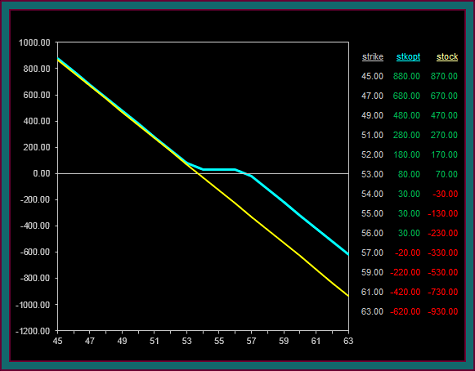
- And remember that I told you our options trade when done was around -70 delta, when the stock has -100 delta
- We are comparing to a stock short done at 53.70 with a long 53.50 put – so this is essentially the same price for the downside profit
- The options trade was done at a credit, thus giving it a profit advantage
- And the call was sold out of the money, especially compared to the current stock price – further increasing the profit advantage, and especially lower the risk of an immediate reverse back into buy
- Look at what would happen at 56.00, if both of these positions were still held
- The options trade would still have a $30 profit, while the short stock would lose $230
Position Trading Strategy Videos
As mentioned at the beginning of the video, these trades were intended to show the basics of combining a stock trade with direction and an options trade against it that was counter direction – using a purchase of 100 shares of stock and 1 contract for both the option sell and option buy.
Here are some of the things that will be discussed in upcoming videos:
- Beginning the stock buy with 300 shares and the related options trade size
- Options trading intended to set up short options ratio shorts
- A stock reverse from buy to sell, while also short an options synthetic sell
- Options trades that are done if the stock sell goes to support
- Starting the position with an options sell instead of a stock trade
Be the first to comment