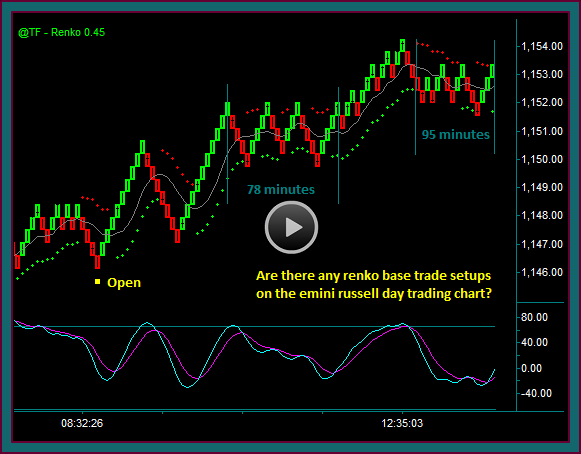
The renko chart base trade setup that we have been discussing is the midline reject brick pattern reverse, after the price envelope reversal and with momentum.
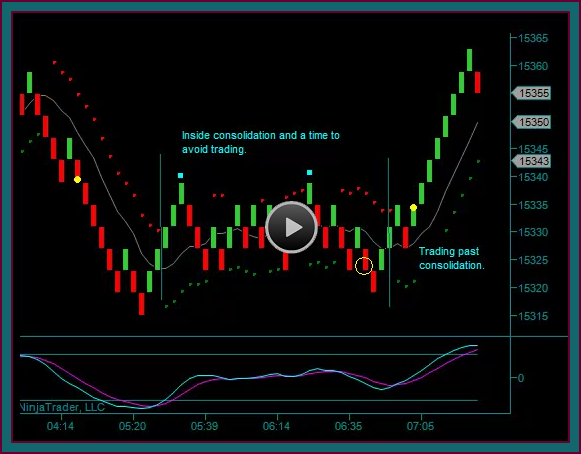
But what if you are day trading the emini russell and you just don’t get this renko trade setup to occur – this is what I will be discussing in the video:
- Are there any renko chart base trade setups
- Can any of the renko price envelope reverses be traded
- What kind of criteria would you use for taking a discretionary trade
Are you wondering why I would bother showing a chart like this emini russell renko chart – a chart where there may not be any renko base trade setups that occurred for the entire trading day?
I would understand if you are wondering this, but then isn’t that the point – if you traded the emini russell on 12/23, then this is the chart and price movement that you had to trade.
Your job as a trader is to avoid taking a number of losing trades that aren’t base setups – and if you didn’t get a trade to take for the whole day then so be it, you also would keep from losing any money taking bad trades from impatience.
Renko Emini Russell Futures Day Trading Chart
And no, using a tick chart instead of a renko chart would not have been easier. Actually, it was more difficult as you would expect from a day that the emini russell had a range of only 8.70 points and spent most of the time going sideways and consolidating.
And to make matters worse, the 2 biggest swings were initial reverses that continued, instead of being renko trading base setups – leading to 2 questions:
- Do you see the renko chart base setup that I am referring to?
- At this point in our renko chart trading, it is the price envelope reverse-midline reject with mex flow that we are calling a base setup
- Could we have traded any of the renko price envelope reversals as a discretionary or mechanical trade, even though they wouldn’t have been our renko base trade setup?
- And if you did, could you have seen and avoided the trades that would be consolidation trades only
- This is the only way we would want to take the initial reverse trades – we don’t want to end up taking them all and getting whipsawed in consolidation
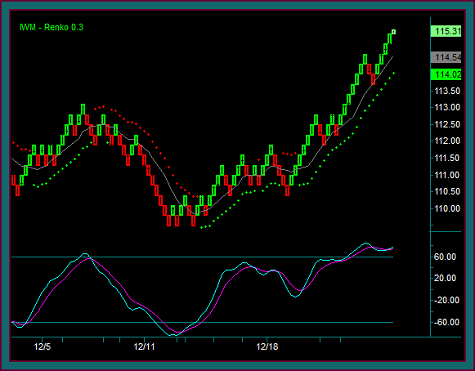
IWM ETF Renko Position Trading Chart
You are now looking at the renko chart for the russell ETF – the symbol is IWM.
Now do you see any of our renko chart base trade setups? That is what we are going to discuss on our next trading video.
This will include talking about position trading the IWM using our trading method strategies stock and options combination trades. And doing so with a portfolio approach, meaning trading a group of ETFs, which is one of the new trading strategies we will be talking about for the new year.
Be the first to comment