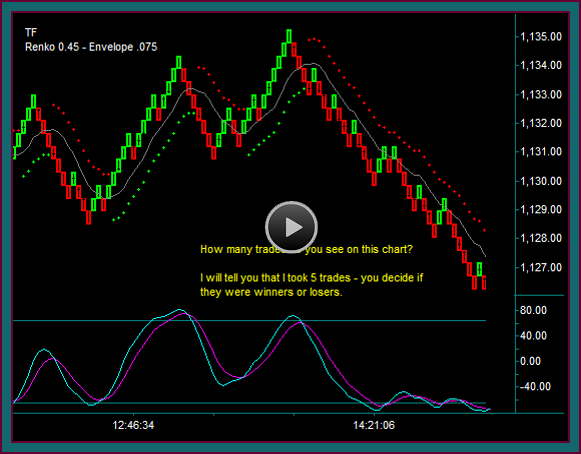
I showed you an emini russell renko day trading chart at the end of the previous emini dow day trading video. I mentioned that there were 5 day trades taken during the period, and asked where the setups were and whether you thought they were winning or losing trades.
I now want to review those emini russell day trades and setups – but before we do this, I first want to make some comments about renko trading charts.
You have been looking at the chart I showed you in the video, now I want you to look a different emini russel chart for the same trading period.
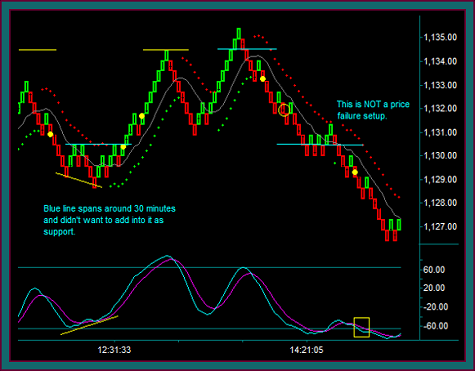
Here is the actual renko chart that was traded – do you see the difference?
The first chart was a ‘historical’ chart, meaning that I had rebooted my computer and re-opened the trading program before doing the screen print, and then saw the differences between the 2 charts. I showed it at the end of the emini dow video, because I knew that I wanted to discuss this further.
The charts are similar, but there are also some notable differences. This is not an issue for trading – you obviously will be trading the real time chart and day trade setup. But it would make some difference for studying and comparing charts to what you may see on a trading video.
And if you think the differences between your charts and mine are too much, then maybe it’s internet connection related. Send me some chart for me to compare, and maybe we will want to change some brick settings.
So, again I will ask you the same question: do you see my 5 emini russell day trades and were the winners or losers?
Emini Russell Renko Chart Day Trading
It was seeing charts like these, when I initially started working with renko charts for emini russell day trading and the price envelope reverse indicator, that I knew that the renko trading strategies were definitely worth pursuing.
You remember how I mentioned in the last emini dow day trading video that I had chosen the chart period because it was typical – well, in this case I chose this emini russell day trading period, because it was atypical:
- There were continual renko base trade setups
- There was an extended emini russell price swing
- There were emini russell addon setups
- And yes, there were a couple of price envelope reverses that didn’t have trade setups
- But they were not the biggest swings, like the emini dow had
- And they weren’t significant in terms of being profitable for the trading period
We had been able to be moderately profitable from the emini dow day trades – and now these emini russell day trades were very profitable, with 5 winning trades and no losing trades.
Let me also add another comparison between the emini dow video and these emini russell trades, in terms of maximizing the potential of the available setups:
- There are always going to be trading periods that are moderately profitable or have losses
- And the fewer the setups and/or more consolidation that there is – limiting trades or avoiding trading that particular contract is what is most important
- But when you have a trading period like we are discussing – it is important to make profits relative to what is available, and as an offset to other trading periods
- It would be a big problem if you made the same amount of money from those emini dow trades as from these emini russell trades
Emini Russell Day Trade Review
I want to review the emini russell day trade setups and trades now. But interestingly I don’t have a lot to say, which is typical of the best trading periods, because they are also the clearest.
- Yellow dot1: Base renko trade setup – it never did get to a 1127.10 profit target, but there was a pmd low partial of 20 ticks
- Yellow dot2: Base renko trade setup 1130.40 that I particularly liked, with the pmd low counter price failure
- Yellow dot3: note that the price target would appear to be the yellow line from the renko chart – but the actual price is 1134.50, giving the addon buy at 1131.60 room for a partial
-
- Price went to 1134.70 – giving a good extended partial for buy1
- This is the time to take multiple partials on the trades – you are at double top resistance with a momentum extreme
- Price envelope reverse – no trade
- Price envelope reverse-resumption no trade
- Price went to 1134.70 – giving a good extended partial for buy1
- Yellow dot4: Base renko trade setup 1133.10 – that also includes the shift of the yellow-blue price line back to resistance
- 1130.70 price target-blue price line synch – I got partial1 at 1131 and partial2 at 1130 on a move to a 1129.70 180t pmd low
- Hold the trailer – and do note that there is nothing that would construe a failure setup going back through the blue line
- Also there was an addon setup at the yellow circle, but no trade because there was not profit room to support
- Yellow dot5: Base renko momentum resumption trade setup
- After the break of support and resistance shift-reject with the midline reject
- And you can see in the yellow box around mex flow that the 3 renko brick setup pattern was after the mex cross back
- Still short the initial trade and addon trade at the end of the chart
And that was it for emini russell day trading for 1/31 between 12pm and 3pm central time.
Again, this was a very good trading period, showing the strength of our renko chart trading strategies, along with the importance of wanting to try and gain profits that are consistent with the trade setups and trading potential available.
Be the first to comment