
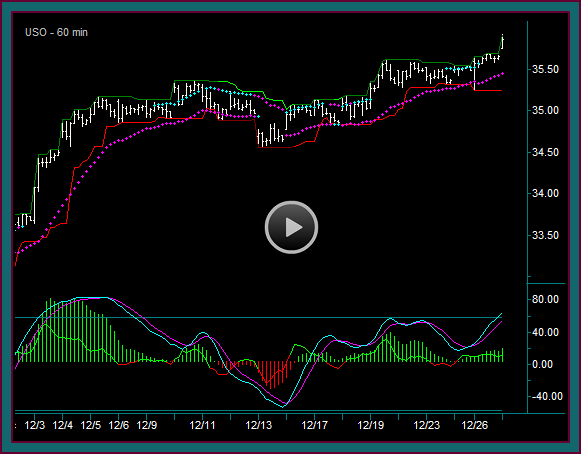
This etf position trading video will continue our discussion on trading with multiple time frame charts, along with doing options collar trades for protecting profits during counter direction price retraces.
The options collar would be done at support or resistance, or after a price momentum failure – and is intended to give profit protection during a retrace, while holding the trade for the swing to continue its directional move.
I now want to go back over some of the iwm etf trades that were discussed, and as we go through them also talk about etf position trading management. Additionally, we will look at the mechanics of the options collar protection in our options trading spreadsheet.
We are going to look at 2 different IWM and options trades:
- IWM daily chart buy that is managed on the daily chart
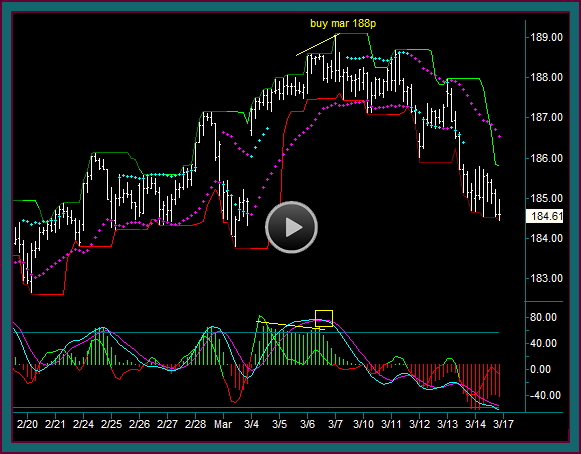
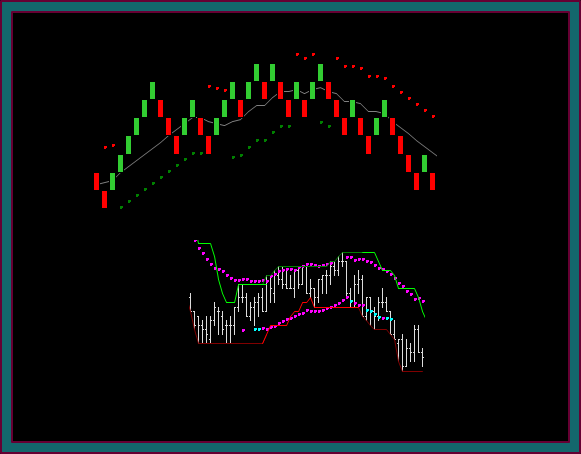
- IWM 60 minute and renko chart combination – and my actual trades using our stock and options trading method strategies
ETF Position Trading And Option Collars
Trade1
The first trade was the example of trading a daily chart – the trade was a buy at 112.90, with price support at 111.62.
- Why 111.62 as support instead of 114.16, especially after the trade had gone to 115.97 and a move back to 111.62 would turn the trade into a loss?
- This would be a very good question – do you remember where support was on the 60 minute chart that I showed for a multiple time frame combination?
That price was 114.78 – if I was long 112.90 and the 114.78-114.16 area couldn’t hold as support, I would want to exit my trade.
But the answer regarding the 111.62 price was it’s the previous high and the breakout to higher highs, synching with the dc dots and where you would anticipate the daily chart would reverse.
There is a tradeoff involved here – letting your trading time frame have room to hold your trade –vs- not letting a good profit in a trade become a loss.
- I would rather have the profit and miss a continuation move that didn’t have a setup for getting back into the trade
- I want to manage real profits and losses –vs- potential paper profit
- And if there is continuation without a re-entry, also remember how many other stocks or ETFs that may have an entry setup – we certainly don’t need to be concerned about trading the same thing
And now you see the benefit of the options collar for protection – it will let you lock in a minimum amount of profit if there is a move to support, while allowing the trade the room to retrace and resume.
Options Spreadsheet Trade1
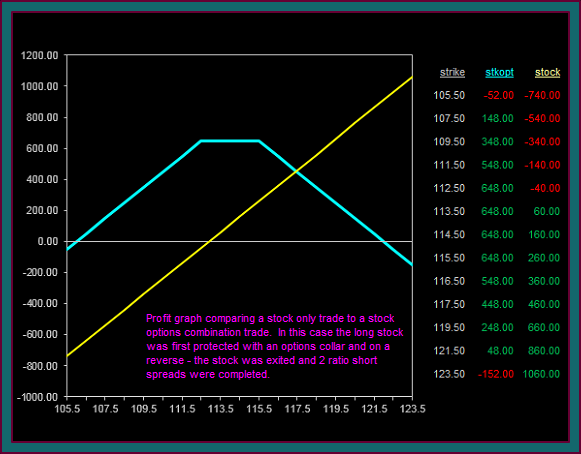
Let’s look at the options spreadsheet and compare the stock only trade to a stock and options collar combination. Note that I am showing this as a 100 share trade only, so the partial profits from an actual trade won’t be added – this makes no difference to the comparison of the 2 trades.
- 112.90 buy [begin 108.90 .5 incr]
- Input options trades – done around 114.75 daily chart bar area lows
- -115c 1.00 +114.5p 1.11
- -111.5p .40
- 3 leg option collar protects daily support – and is done at a credit
- If reverse and fill exit at 111.50 – you would make 189.00 instead of losing -140.00
- If resume and go back above 115.00 – your trade is capped at a gain of 239.00, but the stock only trade makes 210.00
- It’s above this area where the stock only makes more money than the stock and options collar trade combination – presuming there is no addon setup
- NOTE: I really don’t like the 115 strike for the call short on the daily chart only – I am ok with it on a daily and 60 minute multiple chart combination
- I would have rather sold a 115.5c – but you will remember from the previous video that the .50 strikes weren’t available, when the trade was done
- The alternative would have been to go to the next expiration and sell a 116c and buy a 114p – it wouldn’t have the same sensitivity to a quick move, because it has less delta, but it would have given additional upside participation
- NOTE: I really don’t like the 115 strike for the call short on the daily chart only – I am ok with it on a daily and 60 minute multiple chart combination
Trade2
Now I want to discuss the options trades that were done. They are based on our stock and options combination strategies for selling options that can be turned into ratio short spreads – they do have an option collar characteristic as well.
The IWM ETF trades that were done on the daily chart buy mode were from this renko trading chart at 110.30, with a 112.90 addon – I am going to discuss the first buy in the options spreadsheet.
Options Spreadsheet Trade2
- 110.30 buy input
- Input options trades done – renko midline break with mex cross
- -2 115c 1.00 +1 114.5p 1.11
- I am doing the -c+p options collar – but there is the additional call sold for trying to complete a ratio spread
- Like the previous example, the additional options legs were done at the renko double bottom
- This is arithmetic and the ability to complete both ratio short spreads at a credit
- Choosing this timing instead of waiting for more movement down was a function of (1) the 113.10 shift line support right under this area (2) seeing the price-momentum stall and how long the lows had held
- +1 113.50c 1.23 -2 113p .75
- Ratio call short .77 credit
- Ratio put short .39 credit
- Unlike the daily chart trade example, I am also showing the IWM buy profit – because it was closed at 114.62, instead of held
Now look at the profit graph and compare it to the 112.90 IWM buy – if only the stock was traded and no options collar had been done.
This position with the 2 ratio short spreads and the buy exit profit, would participate past the previous high of 115.97 – and does better than the 112.90 buy that was held until around 117.50.
And then there is a very big difference if the IWM keeps going down – look at that 111.50 daily support and the area for the exit of the buy. This big difference is a function of exiting the long stock and having that real profit – and if there is a reverse back into buy, you can see how much room we would have before the ratio call short would need to be protected.
Under any circumstance, I would have done the daily buy and options collar. But I would rather trade the faster multiple chart combination, with our options trading strategies. I think it would outperform the majority of the daily chart holds, especially when you consider the price room you have for re-entering the daily swing if it continues, instead of reversing.
Be the first to comment