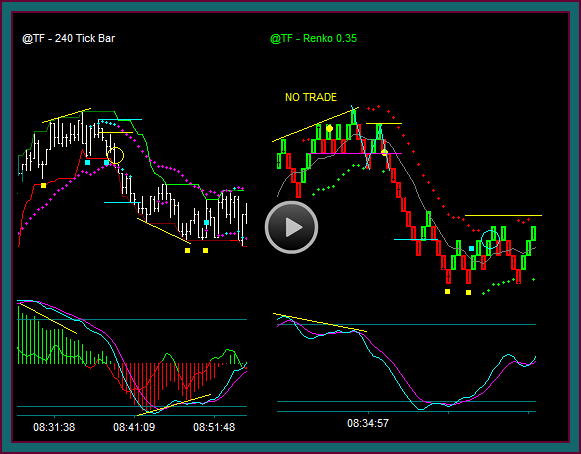
Let’s go forward with our discussion on trade management and day trading the emini russell futures, with the combination of a renko trading chart and tick chart.
You will remember the current chart, from the end of the first emini russell futures day trading management video. We discussed the yellow dot renko chart trade, and how the blue lines on the 240 tick chart were established for the initial risk and first partial target.
You can see the link to the first trading video, and if you haven’t watched it yet, then I would suggest you watch it before continuing with this video.
Emini Russell 240 Tick Chart Trades And Management
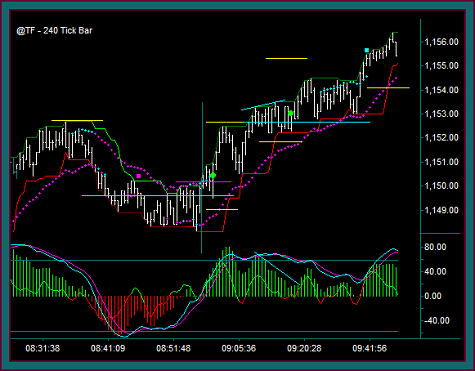
I now want to go forward and discuss the 240 tick and renko charts, for the remaining emini russell trades and trade management – let’s first look at the 240 tick chart, since that is where we will best fine our relevant price points.
- Blue line – sell price target1
- Purple line – pmd failure counter point focus line
- Buy the blue line reject-purple line break with mex flow
- Green dot 1150.30
- The initial risk is below the 1149.50 blue line – 1149.20-.10 would give it room to hold on a retest
- The first profit target is the yellow line – 1152.70 is the initial high
- The profit was taken at 1152.30 = 20 ticks – as a function of the momentum extreme testing the target
- After the target test-momentum high, there is a retrace – but the chart does stay in buy mode and the area of the purple line as support does hold
- I wouldn’t like the giveback if this trade reverses, but at this point there is no exit
- You would look at your renko chart as well
- We will do this in a moment, but I can tell you that there was no price envelope reverse either – and the trailing contracts were held
- Support holds and the swing resumes and breaks the yellow line price resistance
- Now the key is for resistance to shift to support – note the price action
- Price momentum divergence high
- Take partial2 at 1153.10 = 28 ticks
- Price momentum divergence high
- Now the key is for resistance to shift to support – note the price action
- Support tests reject and chart remains in buy mode
- Green dot 1153.10 pmd failure – continuation buy addon
- Lows under blue line – 1152.20
- Yellow line initial risk – 1151.90-.80 would give room to hold on a retest
- You can see how the yellow-blue price line does shift to support and hold
- Top yellow price line 1155.30 profit target
- This is a left side price – the price action was as support that was retested and broke and then shifted to resistance, making it resistance and the profit target now
- 1153.10 buy has 21 tick profit target and 12-13 tick initial risk
- 1155.60 was the actual profit = 25 ticks on the addon
- 1154.00 becomes the hold after the partial
- Again you can see how room is given to the actual price, which would have been the high before the breakout
- The profit target for the addon buy at 1155.30 is too tight at this point to hold the trade – but I won’t give as much room to hold the addon as the trailer from the initial trade
- 1155.00 is the retrace low and then there is continuation to 1158.30 – and partial2 for the addon was taken at 1157.50 = 44 ticks
Emini Russell Renko Chart Trades And Management
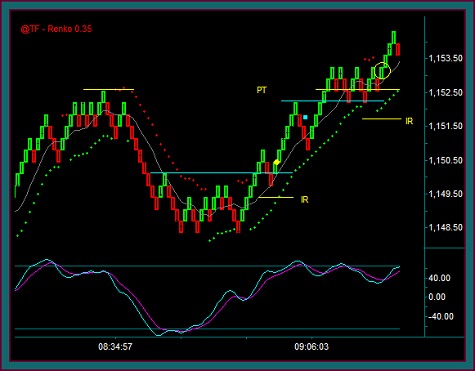
Now let’s look at the renko chart and how it synchs with the 240 tick chart for the trades and trade management just discussed.
Remember, we have no problem taking trades or holding trades on the 240 tick or renko chart independently – but we do want relative chart synch, for instance:
- Trade a setup on either chart at the same time there is a 240 tick initial reverse or a renko chart price envelope reverse
- Hold a trade on the renko chart price envelope reverse, which is a real price being tested as seen on the 240 tick chart
Yellow Dot Buy:
- This buy clearly synchs with the 240t chart as it is the base renko trade setup
- Up sloping midline reject with mex flow
- And the setup uses the blue line from the pmd counter point – this is what I see as the break2 with mex flow pattern on the renko chart
- I marked the initial risk and partial target price areas – actual prices coming from the 240t
- The blue square at the red renko brick would be another way to take a partial profit when the trade doesn’t hit the target price – especially with a momentum extreme
Yellow Circle:
- This is the 240 tick chart addon buy – is it also a renko chart trade setup like the yellow dot?
- My answer would be no – but it would be synched with the 240t and I had no issue taking the trade because of the renko chart
- The entry timing being the green-red-green brick pattern that rejects the original high, with the mex rollback
- You can see where I marked the initial risk – going below the blue line and the obvious brick area
- The profit target is above the highs on the chart
- NOTE that the green-red brick pattern is not a partial profit like I showed at the blue square
- Momentum is building instead of extreme – and the profit target has not been tested
Emini Russell Day Trading And Addon Trades
The ‘power’ of addon trading for these extended trading swings is extremely important – we want to get a profit relative to the potential.
Addon trades have nothing to do with account size or trading size comfort. Consider that your account size and/or comfort ‘zone’ is to trade 2 contracts. Once you have a partial profit you can do no more than trail the remaining contract, also while trying to limit the amount of profit giveback.
Now get an addon setup and only do 1 contract – you are still only at the 2 contract size, and you are once again able to take another partial profit.
Addon trading is especially beneficial, when you consider the days when you get tight ranges and very little to do, or the times where the best trading swing is a renko price envelope reverse that never has an actual trade setup.
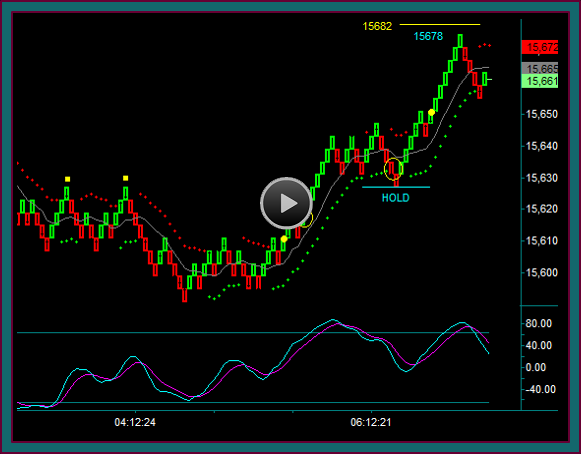
The day following the one we have been discussing only gave me 2 emini russell day trades in the period I was trading:
- A winning trade that didn’t give a full size partial profit
- A 2nd winning trade that only worked because of where initial risk was set, compared to the lower high renko brick into the trade.
That ends the 2nd video discussion on emini russell day trading management and using the tick chart and renko chart together – long and trailing the initial buy and addon buy.
I do have one more video that I want to do for this buy swing, and I will leave you with the following question: Would it make sense to also include a renko chart of a different brick size, especially in the case of an extended directional trading swing?
Be the first to comment