
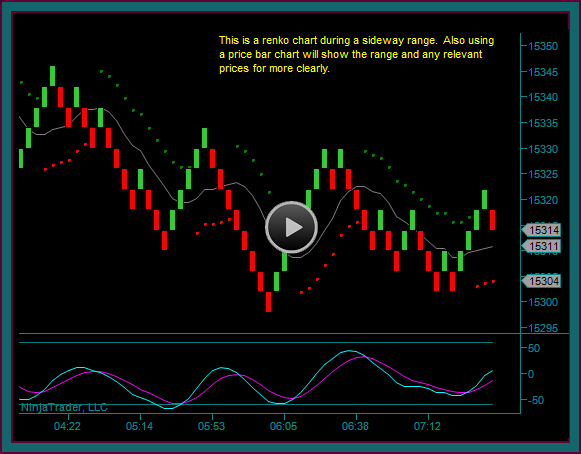
Let’s continue with this renko chart and tick chart trading market replay training video for emini dow day trading, from where we ended the previous video. The current position is short the emini dow at 14627, with a partial profit at 16414 and 16403.
You will remember that at this point I wanted continuation to a next target price of 16389, which was the low price when we started – and I will be looking to hold this trade to the 16412 price area that we have been discussing.
(1) Renko Brick2
- Exit trailing short on 16412 break and price envelope reverse = 16414
- There was also a mex extreme cross on the 180t
- If there is a setup in this area, would you take the trade?
- Not with 16421 resistance, I couldn’t even get a 10 point partial as a position trade – to get this minimum profit to see if price would continue through 16421, while holding 16412 as support
(2) Renko Brick1
- I am switching back to brick1
- But first, here is what the 180 tick looks like – you can see the 16422 price break and chart reverse
- Now looking at the renko brick1 chart – can you see a buy setting up?
- We have all setup components, including a price failure break – but want this red brick to complete and become a midline reject
(3) Renko Brick1
- Renko base setup – long 16423
- 180 tick combined base setup too
- 16421 break2 with mex flow
- 16441 profit target – initial risk below the higher low 16414 price
16444 high and I exited the trade at 16442 – why?
This happens to be the close of the day and it’s Friday – if it was a weekday I probably would have held on to a trailer for a while, to see if the swing would have continued some more.
But since this was an emini dow day trade that wasn’t going to be held, the trade was closed, instead of taking a partial profit and trailing.

Be the first to comment