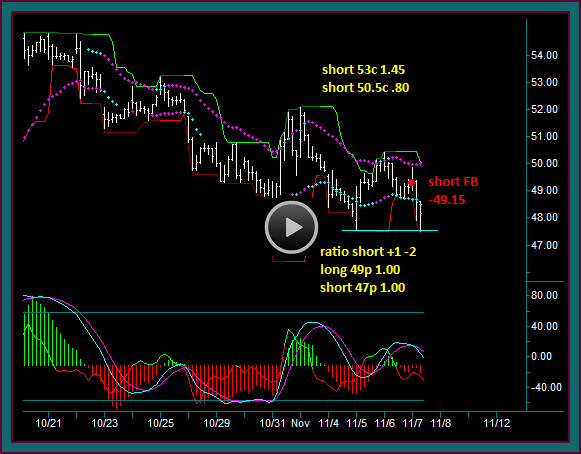
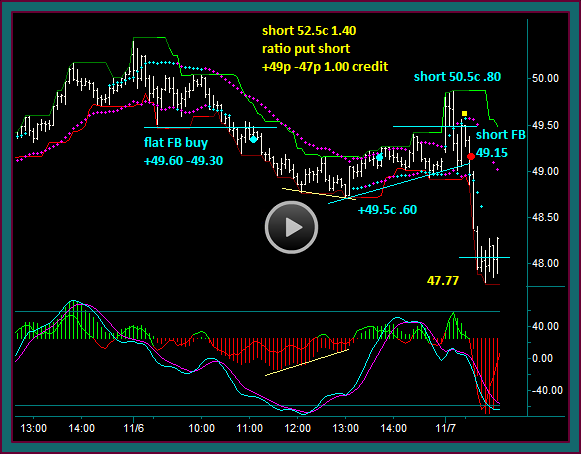
We have used our facebook trading strategies to trade into the following stock options position – short facebook stock at 49.15, with the following short option trades:
- Short 53 calls 1.45
- Short 50.5 call .80
- +1 x -2 ratio put short – long 49p 1.00 short 47p -1.00
The facebook stock short has moved down to 47.77 [2nd to last bar] and we have the following options trading strategies objectives and decisions to make:
- Where are the short options breakeven points and do any of the options need to be protected
- The ratio short put breakeven is 44.00 – and that doesn’t include how the range is extended by the call shorts
- And the short 47 put is a covered trade, since facebook stock is all short
- Additional trades to do if there is a options timing setup based on a confirmed hold of 47.51 support [blue line on the chart]
- In the previous video we modelled a setup from a 47.77 low [the low price when the video ended], with a 5 min momentum extreme – using a stock price of 48.20
- 48.5 call theoretical value 11/15 expiration 1.10
- 46 put theoretical value 11-22 expiration .75
- But if we could get the move and setup from 47.51 [use 47.80] – I would look to buy a 48 call and sell a 45.5 put if I could get the same prices as the 48.5 call-46 put model prices
- 48c thv 1.12 .– 48.5c thv .91
- 46p thv .874 – 45.5p thv .713
- Next support is 46.38
- I want the 48c and would rather sell the 45.5p
- Because it is not against a long put but short stock
- And since the call-put trade will have a cost of around .25 – I would essentially cap the short profits at support
Facebook Stock Option Trading Summary
Trade Review
There was no trade done from the 47.77 low retrace, combined with MEx cross from the momentum extreme – not when a trade done at 48.20 was into 48.71 resistance.
I used this move to take partial profits and reduce some size –vs- paying the .35 debit [theoretical value] for the +48.5c -46p trade – 48.5 +.35 = 48.85 and above resistance
- 10:25ct – there is a retrace back to resistance that rejects into a lower low to 47.41
- On this 47.51 test pmd low – I went ahead and did the +48c -45.5p trade discussed
- +48c 1.25 -45.5p .80
- NOTE: the 60 min chart was a double bottom – but momentum was starting to build.
- If this had instead been a momentum extreme, I would have gone ahead and sold the 46p – looking for a big enough retrace to turn it into a ratio spread
- 10:40ct – 11/7 close
- Nothing else has been done the rest of the day
- Yellow dot2 would not have been done day trading only – not into shift line double top resistance
- And on the resumption I didn’t addon to the facebook shorts – not into right side double bottom support at 47.51 chart support
- 11/8 9:00ct-9:20ct
- Blue dot2 could have been done as a day trade only – but there were no more option trades to do that could improve the +48c -45.5p trade
- Blue dot3 was a test of the shift line resistance and there was enough movement to turn the 45.5p into a ratio short
- With this being 11/8 at 9:20ct – there is plenty of time to use the 11/15 expiration to buy the put against the 45.5 11/22 expiration
- I bought the 48p .90
- +48p .90 -2 45.5p .80 = .70 credit
- The breakeven point for the ratio put spread = 45.5 – 2.5 -.70 = 42.30
- Nothing else has been done the rest of the day
Facebook Closing Stock Option Position 11-11
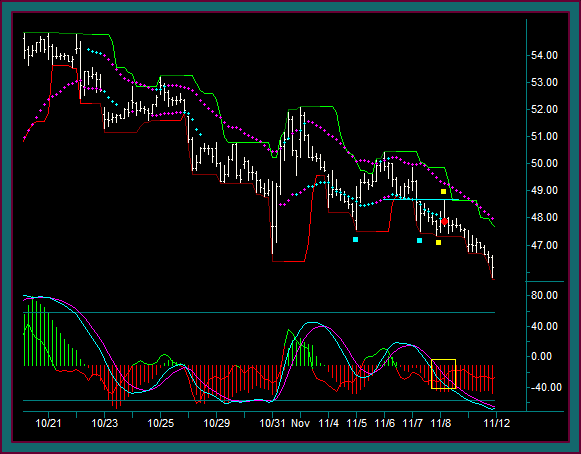
We’re going to finish this video looking at the 60 minute chart again – you are looking at the remainder of the 11/8 trading day.
- The right blue square-yellow square is the right side double bottom of 47.51 I referred to
- Especially look at momentum on this chart along with the blue inside focus line resistance
- This is why I wanted to do anymore call buys or put shorts – but why I wanted to turn the 45.50 put short into the ratio short discussed
- Additionally the top yellow square reject with mex flow – was into a very good breakout pattern that we call a double triple bottom break
- 2 blue squares is triple bottom 1 – blue square-yellow square is triple bottom 2
- This pattern was used to do another facebook short at 47.75
Here is our closing facebook stock option combination position – facebook had a closing low at 45.73, with a closing price of 46.19
- Facebook stock short -49.15 -47.75
- Short 53 calls 1.45
- +1 x -2 ratio put short – long 49p 1.00 short 47p -1.00
- +1 x -2 ratio call short – short 50.5c .80 long 48c 1.25
- NOTE: the 53 calls have been left uncovered
- +1 x -2 ratio put short – short 45.5p .80 long 48p .90
Question: think about the recent videos about using the options legs of open spreads to trade in and out of – do any of the strikes synch with the facebook stock movement we are seeing, where those strategies could be done?
Be the first to comment