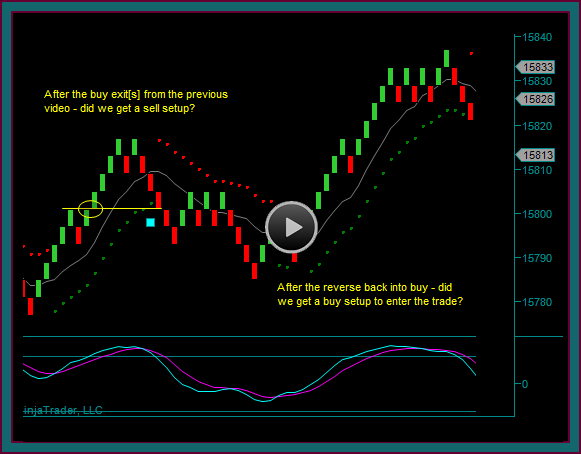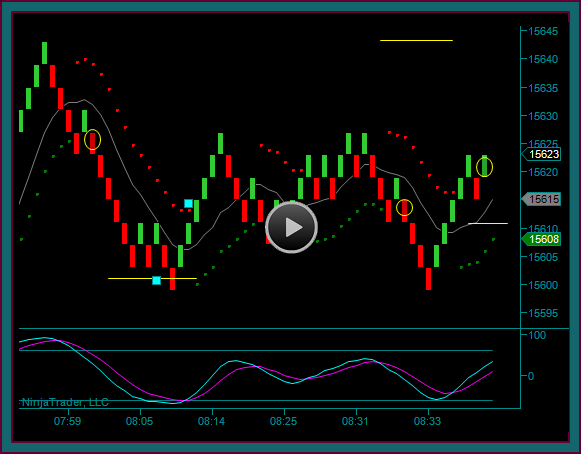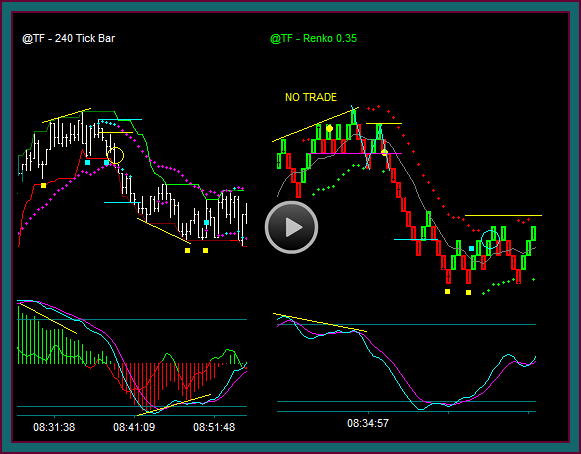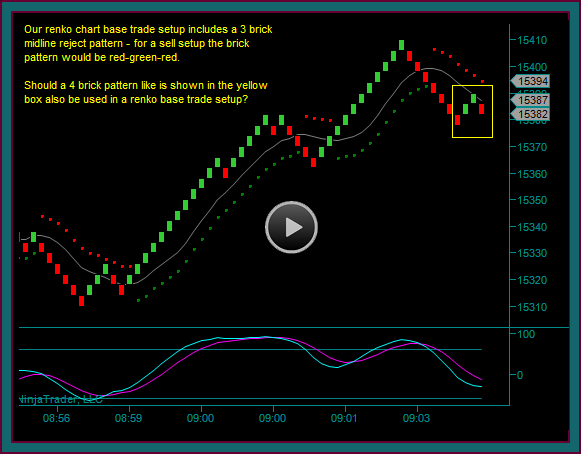
This renko chart day trading training video, will begin with the exit of the emini dow buy discussed in the previous video. The video will discuss any renko trade setup components that exist for doing a sell,along with what else would be needed to actually do a trade.
This is an important real time trading exercise, because you would always have some ‘beginning’ components for a new day trade setup at the time of exit or you would still be trailing the trade – this is typical of the setup ‘stages’ we see:
- Price envelope reverse and mex cross
- Exit or price hold of open trade
- Midline reject and renko brick reject-reversal entry pattern with mex flow
And if we get the necessary trade setup components [with a profit component], we will take the trade – and if not, we will continue to watch and wait for the next actual trade setup.
Renko Chart Day Trading Training Outline
Let’s begin by reviewing the emini dow day trade buy – and then we continue and see if we get our renko sell setup:
(1) Review buy
- Yellow circle buy
- Blue square1 partial
- Price envelope reverse –vs- retrace hold after partial
- Price –vs- indicator
- Blue square2 partial
- Orange square exit
(2) After exit – renko setup components
- Price envelope reverse
- Red-green brick with mex flow
- Looking for the reject-reversal brick combination
- The base setup component is a midline reject
- The yellow line left-right price reject-reversal would also be traded
(3) Renko base trade setup
- Now have the reject-reversal component
- It’s a 4 brick pattern AND includes the yellow line failure break entry [break2 with mex flow]
- Sell 15799 on the 15801 line break
- 15810 area initial risk – 15778 area target1
- 180t
- How a left-right inside price is setup to fail
- Initial risk-profit target1 selection
(4) Price went to 15785 – but ‘nothing’ to base a partial on
- Exit 15804
- Price break-price envelope reverse combination
- And going through process again looking for buy setup
- Have setup components – except brick pattern midline reject
(5) You can see that we have gone to the renko high after the 15801 break – did you have a buy setup?
- Renko price envelope reverse only
- 180t base setup- 15800 buy
- 180t
- SHOW horizontal-diagonal – can also see this on renko chart
- Note this as example of a non-consolidation renko reverse buy – even if 180t initial reverse
- Discuss partial taking at this point
- Would be 15 partial if timed with red brick
- Rising dot slope and mex flow
- And addon setup
- 180t sync –vs- pmd high – in which case would have taken partial
- Is there an addon setup?
- Yes – you are looking at a resistance double top and red-green brick with mex flow
- Potential setup for a resistance triple top breakout at 15818
- 15833-15846 targets as discussed in previous video
- Below 15808 initial risk area is good risk-reward
(6) The renko bricks you see going sideways are testing 15833 resistance
- 15835 180t real price and pmd high
- 15833 addon partial and initial partial1
- Take 2 addon partials
- Trail 1 initial 1 addon – allows for another partial
- Hold shifts to 15817 area-price envelope red dot area
(7) Renko pmd high shows as 180t double top after pmd high
- 15827 addon exit on midline break price envelope reverse
- Was also looking to exit as function of the dual chart momentum read
- Trailing 1 initial still for the 15817 resistance to support area


Be the first to comment